
Page 30 - Toolkit
P. 30
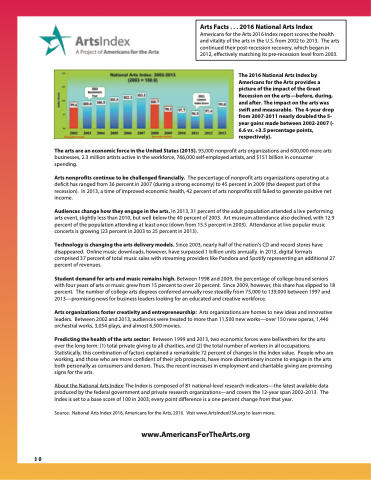
  Arts Facts . . . 2016 National Arts Index
Americans for the Arts 2016 Index report scores the health and vitality of the arts in the U.S. from 2002 to 2013. The arts continued their post-recession recovery, which began in 2012, effectively matching its pre-recession level from 2003.
The 2016 National Arts Index by Americans for the Arts provides a picture of the impact of the Great Recession on the arts—before, during, and after. The impact on the arts was swift and measurable. The 4-year drop from 2007-2011 nearly doubled the 5- year gains made between 2002-2007 (- 6.6 vs. +3.5 percentage points, respectively).
The arts are an economic force in the United States (2015). 95,000 nonprofit arts organizations and 600,000 more arts businesses, 2.3 million artists active in the workforce, 766,000 self-employed artists, and $151 billion in consumer spending.
Arts nonprofits continue to be challenged financially. The percentage of nonprofit arts organizations operating at a deficit has ranged from 36 percent in 2007 (during a strong economy) to 45 percent in 2009 (the deepest part of the recession). In 2013, a time of improved economic health, 42 percent of arts nonprofits still failed to generate positive net income.
Audiences change how they engage in the arts. In 2013, 31 percent of the adult population attended a live performing arts event, slightly less than 2010, but well below the 40 percent of 2003. Art museum attendance also declined, with 12.9 percent of the population attending at least once (down from 15.5 percent in 2003). Attendance at live popular music concerts is growing (23 percent in 2003 to 25 percent in 2013).
Technology is changing the arts delivery models. Since 2003, nearly half of the nation’s CD and record stores have disappeared. Online music downloads, however, have surpassed 1 billion units annually. In 2013, digital formats comprised 37 percent of total music sales with streaming providers like Pandora and Spotify representing an additional 27 percent of revenues.
Student demand for arts and music remains high. Between 1998 and 2009, the percentage of college-bound seniors with four years of arts or music grew from 15 percent to over 20 percent. Since 2009, however, this share has slipped to 18 percent. The number of college arts degrees conferred annually rose steadily from 75,000 to 139,000 between 1997 and 2013—promising news for business leaders looking for an educated and creative workforce.
Arts organizations foster creativity and entrepreneurship: Arts organizations are homes to new ideas and innovative leaders. Between 2002 and 2013, audiences were treated to more than 11,500 new works—over 150 new operas, 1,446 orchestral works, 3,054 plays, and almost 6,500 movies.
Predicting the health of the arts sector: Between 1999 and 2013, two economic forces were bellwethers for the arts over the long term: (1) total private giving to all charities, and (2) the total number of workers in all occupations. Statistically, this combination of factors explained a remarkable 72 percent of changes in the Index value. People who are working, and those who are more confident of their job prospects, have more discretionary income to engage in the arts both personally as consumers and donors. Thus, the recent increases in employment and charitable giving are promising signs for the arts.
About the National Arts Index: The Index is composed of 81 national-level research indicators—the latest available data produced by the federal government and private research organizations—and covers the 12-year span 2002-2013. The Index is set to a base score of 100 in 2003; every point difference is a one percent change from that year.
Source: National Arts Index 2016, Americans for the Arts, 2016. Visit www.ArtsIndexUSA.org to learn more.
www.AmericansForTheArts.org
     30
