
Page 13 - TVH 2000 Anniversary Shipwreck Project
P. 13
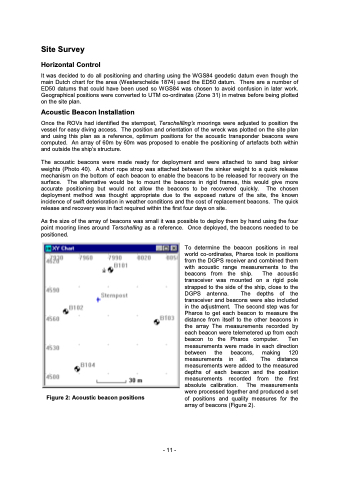
Site Survey Horizontal Control It was decided to do all positioning and charting using the WGS84 geodetic datum even though the main Dutch chart for the area (Westerschelde 1874) used the ED50 datum. There are a number of ED50 datums that could have been used so WGS84 was chosen to avoid confusion in later work. Geographical positions were converted to UTM co-ordinates (Zone 31) in metres before being plotted on the site plan. Acoustic Beacon Installation Once the ROVs had identified the sternpost, Terschellling’s moorings were adjusted to position the vessel for easy diving access. The position and orientation of the wreck was plotted on the site plan and using this plan as a reference, optimum positions for the acoustic transponder beacons were computed. An array of 60m by 60m was proposed to enable the positioning of artefacts both within and outside the ship’s structure. The acoustic beacons were made ready for deployment and were attached to sand bag sinker weights (Photo 40). A short rope strop was attached between the sinker weight to a quick release mechanism on the bottom of each beacon to enable the beacons to be released for recovery on the surface. The alternative would be to mount the beacons in rigid frames, this would give more accurate positioning but would not allow the beacons to be recovered quickly. The chosen deployment method was thought appropriate due to the exposed nature of the site, the known incidence of swift deterioration in weather conditions and the cost of replacement beacons. The quick release and recovery was in fact required within the first four days on site. As the size of the array of beacons was small it was possible to deploy them by hand using the four point mooring lines around Terschelling as a reference. Once deployed, the beacons needed to be positioned. Figure 2: Acoustic beacon positions To determine the beacon positions in real world co-ordinates, Pharos took in positions from the DGPS receiver and combined them with acoustic range measurements to the beacons from the ship. The acoustic transceiver was mounted on a rigid pole strapped to the side of the ship, close to the DGPS antenna. The depths of the transceiver and beacons were also included in the adjustment. The second step was for Pharos to get each beacon to measure the distance from itself to the other beacons in the array The measurements recorded by each beacon were telemetered up from each beacon to the Pharos computer. Ten measurements were made in each direction between the beacons, making 120 measurements in all. The distance measurements were added to the measured depths of each beacon and the position measurements recorded from the first absolute calibration. The measurements were processed together and produced a set of positions and quality measures for the array of beacons (Figure 2). - 11 -
