
Page 17 - TVH 2000 Anniversary Shipwreck Project
P. 17
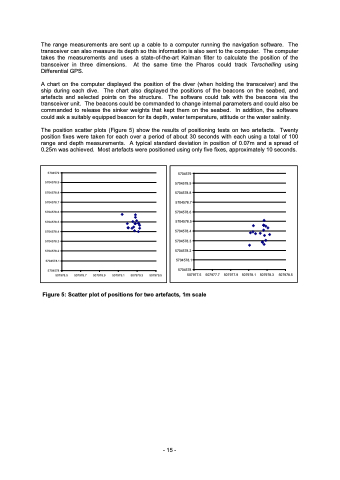
The range measurements are sent up a cable to a computer running the navigation software. The transceiver can also measure its depth so this information is also sent to the computer. The computer takes the measurements and uses a state-of-the-art Kalman filter to calculate the position of the transceiver in three dimensions. At the same time the Pharos could track Terschelling using Differential GPS. A chart on the computer displayed the position of the diver (when holding the transceiver) and the ship during each dive. The chart also displayed the positions of the beacons on the seabed, and artefacts and selected points on the structure. The software could talk with the beacons via the transceiver unit. The beacons could be commanded to change internal parameters and could also be commanded to release the sinker weights that kept them on the seabed. In addition, the software could ask a suitably equipped beacon for its depth, water temperature, attitude or the water salinity. The position scatter plots (Figure 5) show the results of positioning tests on two artefacts. Twenty position fixes were taken for each over a period of about 30 seconds with each using a total of 100 range and depth measurements. A typical standard deviation in position of 0.07m and a spread of 0.25m was achieved. Most artefacts were positioned using only five fixes, approximately 10 seconds. 5704579 5704578.9 5704578.8 5704578.7 5704578.6 5704578.5 5704578.4 5704578.3 5704578.2 5704578.1 5704578 507978.5 507978.7 507978.9 507979.1 507979.3 507979.5 Figure 5: Scatter plot of positions for two artefacts, 1m scale 5704579 5704578.9 5704578.8 5704578.7 5704578.6 5704578.5 5704578.4 5704578.3 5704578.2 5704578.1 5704578 507977.5 507977.7 507977.9 507978.1 507978.3 507978.5 - 15 -
