
Page 115 - Quantitative Data Analysis
P. 115
Quantitative Data Analysis
Simply Explained Using SPSS
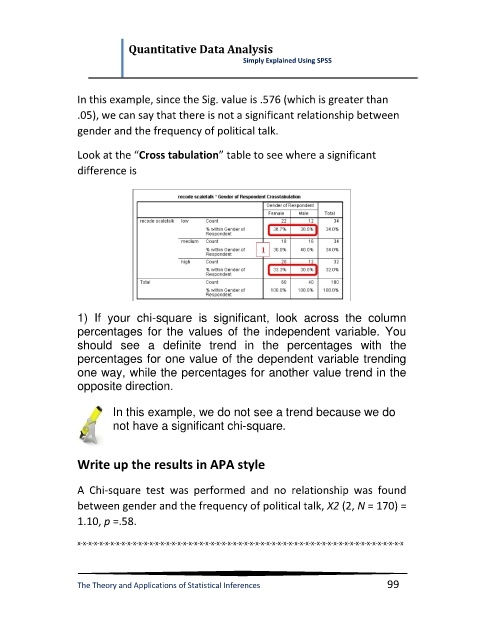
In this example, since the Sig. value is .576 (which is greater than
.05), we can say that there is not a significant relationship between
gender and the frequency of political talk.
Look at the “Cross tabulation” table to see where a significant
difference is
1) If your chi-square is significant, look across the column
percentages for the values of the independent variable. You
should see a definite trend in the percentages with the
percentages for one value of the dependent variable trending
one way, while the percentages for another value trend in the
opposite direction.
In this example, we do not see a trend because we do
not have a significant chi-square.
Write up the results in APA style
A Chi-square test was performed and no relationship was found
between gender and the frequency of political talk, X2 (2, N = 170) =
1.10, p =.58.
x-x-x-x-x-x-x-x-x-x-x-x-x-x-x-x-x-x-x-x-x-x-x-x-x-x-x-x-x-x-x-x-x-x-x-x-x-x-x-x-x-x-x-x-x-x-x-x-x-x-x-x-x-x-x-x-x-x-x
The Theory and Applications of Statistical Inferences 99