
Page 194 - Quantitative Data Analysis
P. 194
Quantitative Data Analysis
Simply Explained Using SPSS
are. Sometimes, it happens and researchers or statisticians do not
consider its effect that leads them into wrong conclusion. For
example in following correlation matrix:
Y X 1 X 2
Y 1.00
X 1 0.67 1.00
X 2 0.00 0.78 1.00
X 1 is correlated with Y, X 2 is not correlated with Y, but it is
correlated with X 1. In this case, X 2 will be considered as suppressor
variable.
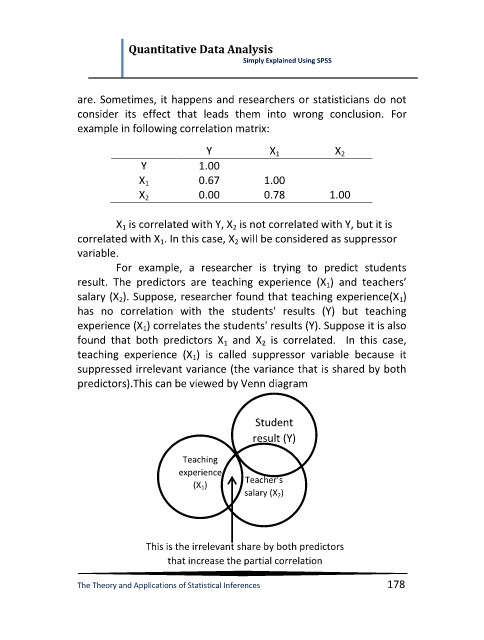
For example, a researcher is trying to predict students
result. The predictors are teaching experience (X 1) and teachers’
salary (X 2). Suppose, researcher found that teaching experience(X 1)
has no correlation with the students' results (Y) but teaching
experience (X 1) correlates the students' results (Y). Suppose it is also
found that both predictors X 1 and X 2 is correlated. In this case,
teaching experience (X 1) is called suppressor variable because it
suppressed irrelevant variance (the variance that is shared by both
predictors).This can be viewed by Venn diagram
Student
result (Y)
Teaching
experience Teacher’s
(X 1 )
salary (X 2 )
This is the irrelevant share by both predictors
that increase the partial correlation
The Theory and Applications of Statistical Inferences 178