
Page 192 - Quantitative Data Analysis
P. 192
Quantitative Data Analysis
Simply Explained Using SPSS
2
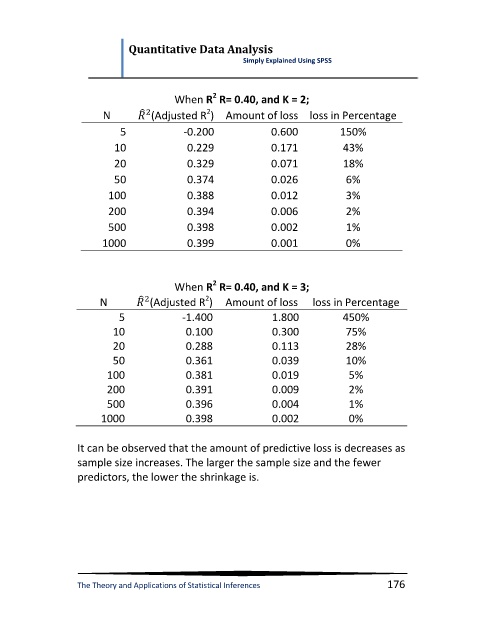
When R R= 0.40, and K = 2;
2
̂
N (Adjusted R ) Amount of loss loss in Percentage
5 -0.200 0.600 150%
10 0.229 0.171 43%
20 0.329 0.071 18%
50 0.374 0.026 6%
100 0.388 0.012 3%
200 0.394 0.006 2%
500 0.398 0.002 1%
1000 0.399 0.001 0%
2
When R R= 0.40, and K = 3;
̂
2
N (Adjusted R ) Amount of loss loss in Percentage
5 -1.400 1.800 450%
10 0.100 0.300 75%
20 0.288 0.113 28%
50 0.361 0.039 10%
100 0.381 0.019 5%
200 0.391 0.009 2%
500 0.396 0.004 1%
1000 0.398 0.002 0%
It can be observed that the amount of predictive loss is decreases as
sample size increases. The larger the sample size and the fewer
predictors, the lower the shrinkage is.
The Theory and Applications of Statistical Inferences 176