
Page 191 - Quantitative Data Analysis
P. 191
Quantitative Data Analysis
Simply Explained Using SPSS
Adjusted R Squared (Amount of Shrinkage)
The shrinkage is the amount of predictive loss that we would
observed if we apply similar model to another sample. In other
2
words, the adjusted R is the amount of shrinkage, which means
that if we apply the similar model to any other sample we would
loss the slight amount of predictive power. The formula to calculate
2
the amount of shrinkage (Adjusted R ) is
̂
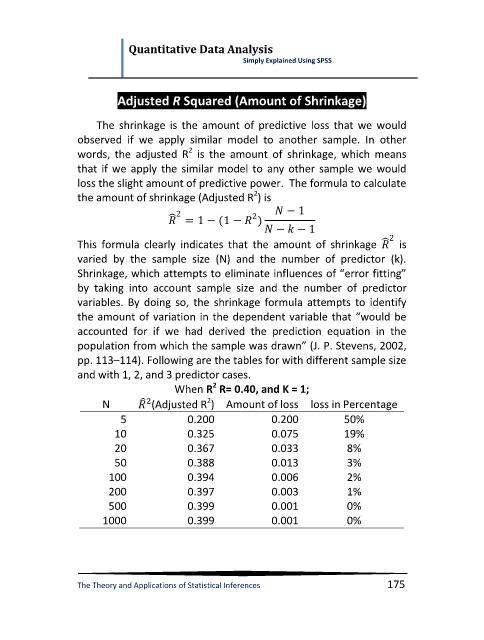
This formula clearly indicates that the amount of shrinkage ̂ is
varied by the sample size (N) and the number of predictor (k).
Shrinkage, which attempts to eliminate influences of “error fitting”
by taking into account sample size and the number of predictor
variables. By doing so, the shrinkage formula attempts to identify
the amount of variation in the dependent variable that “would be
accounted for if we had derived the prediction equation in the
population from which the sample was drawn” (J. P. Stevens, 2002,
pp. 113–114). Following are the tables for with different sample size
and with 1, 2, and 3 predictor cases.
2
When R R= 0.40, and K = 1;
̂
2
N (Adjusted R ) Amount of loss loss in Percentage
5 0.200 0.200 50%
10 0.325 0.075 19%
20 0.367 0.033 8%
50 0.388 0.013 3%
100 0.394 0.006 2%
200 0.397 0.003 1%
500 0.399 0.001 0%
1000 0.399 0.001 0%
The Theory and Applications of Statistical Inferences 175