Page 39 - Quantitative Data Analysis
P. 39

Quantitative Data Analysis
                                              Simply Explained Using SPSS
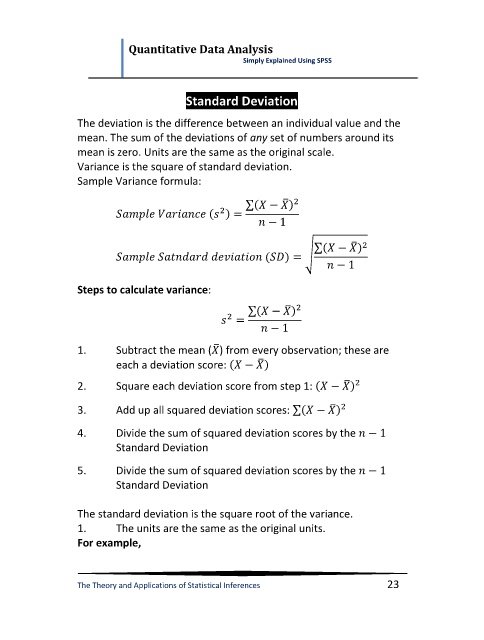

                                    Standard Deviation

               The deviation is the difference between an individual value and the
               mean. The sum of the deviations of any set of numbers around its
               mean is zero. Units are the same as the original scale.
               Variance is the square of standard deviation.
               Sample Variance formula:

                                                      ̅
                                               ∑


                                                                  ̅
                                                           ∑
                                                          √


               Steps to calculate variance:

                                                      ̅
                                               ∑


                                         ̅
               1.      Subtract the mean ( ) from every observation; these are
                                                 ̅
                       each a deviation score:

                                                                 ̅

               2.      Square each deviation score from step 1:

                                                              ̅

               3.      Add up all squared deviation scores: ∑

               4.      Divide the sum of squared deviation scores by the
                       Standard Deviation

               5.      Divide the sum of squared deviation scores by the
                       Standard Deviation

               The standard deviation is the square root of the variance.
               1.      The units are the same as the original units.
               For example,

               The Theory and Applications of Statistical Inferences           23
   34   35   36   37   38   39   40   41   42   43   44