
Page 35 - Quantitative Data Analysis
P. 35
Quantitative Data Analysis
Simply Explained Using SPSS
Example:
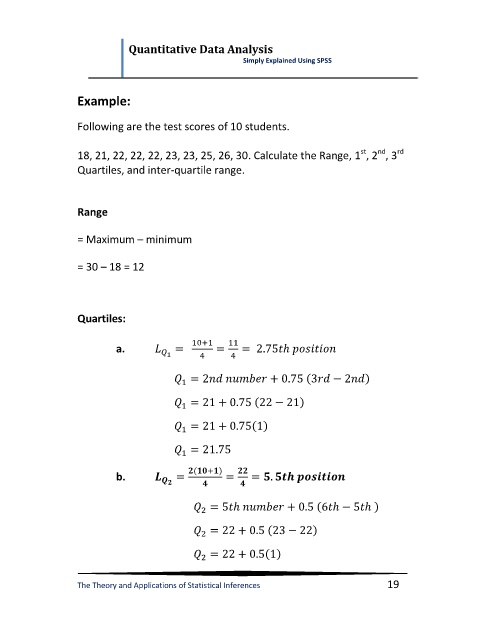
Following are the test scores of 10 students.
st
nd
rd
18, 21, 22, 22, 22, 23, 23, 25, 26, 30. Calculate the Range, 1 , 2 , 3
Quartiles, and inter-quartile range.
Range
= Maximum – minimum
= 30 – 18 = 12
Quartiles:
a.
b.
The Theory and Applications of Statistical Inferences 19