
Page 37 - A Study of Traditional Chinese Religions in Malaysia: The Decline and the Path Towards Revitalization
P. 37
scriptures and books, 48 percent of them have not while another 27 percent could not tell
whether they have read them.
30.00% 27.00%
24.00% 24.00%
25.00%
20.00%
15.50%
15.00%
9.50% Total
10.00%
5.00%
0.00%
Strongly Disagree Neutral Agree Strongly
disagree agree
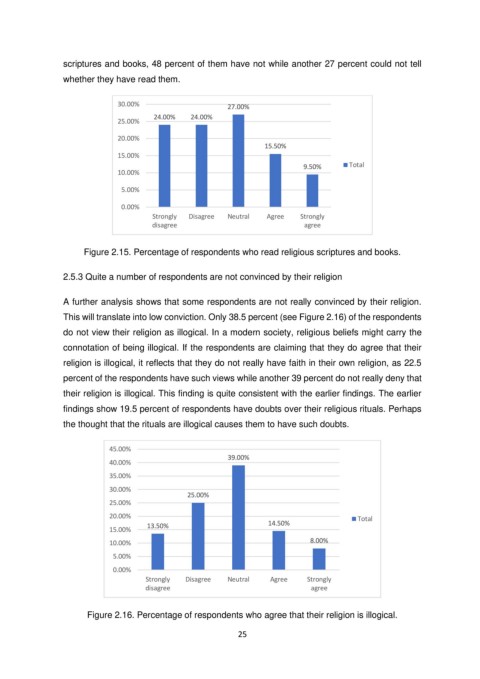
Figure 2.15. Percentage of respondents who read religious scriptures and books.
2.5.3 Quite a number of respondents are not convinced by their religion
A further analysis shows that some respondents are not really convinced by their religion.
This will translate into low conviction. Only 38.5 percent (see Figure 2.16) of the respondents
do not view their religion as illogical. In a modern society, religious beliefs might carry the
connotation of being illogical. If the respondents are claiming that they do agree that their
religion is illogical, it reflects that they do not really have faith in their own religion, as 22.5
percent of the respondents have such views while another 39 percent do not really deny that
their religion is illogical. This finding is quite consistent with the earlier findings. The earlier
findings show 19.5 percent of respondents have doubts over their religious rituals. Perhaps
the thought that the rituals are illogical causes them to have such doubts.
45.00%
39.00%
40.00%
35.00%
30.00%
25.00%
25.00%
20.00% Total
13.50% 14.50%
15.00%
10.00% 8.00%
5.00%
0.00%
Strongly Disagree Neutral Agree Strongly
disagree agree
Figure 2.16. Percentage of respondents who agree that their religion is illogical.
25