
Page 291 - Data Science Algorithms in a Week
P. 291
272 Oloruntomi Joledo, Edgar Gutierrez and Hatim Bukhari
Figure 9. Response of net income to taxation.
In the early phase of the simulation, the initial capital and cost weigh heavily on the
system. The sudden spikes MarketShareDS signifies that the first phase of borrowers in
the different time horizons have completed their loan cycle and new users are being
initialized. Most borrowers return to PotentialBorrower state where they can request new
loan and the process repeats itself. Net income increases slowly in the first two years due
to the fact that the starting number of borrowers is low and because the effect of WOM
only becomes significant with time.
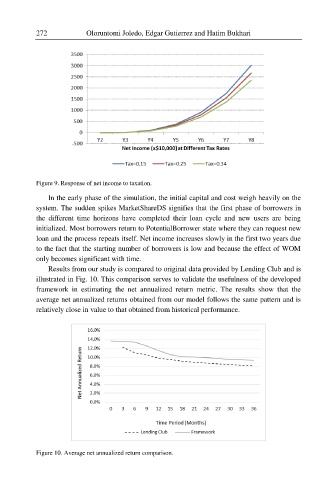
Results from our study is compared to original data provided by Lending Club and is
illustrated in Fig. 10. This comparison serves to validate the usefulness of the developed
framework in estimating the net annualized return metric. The results show that the
average net annualized returns obtained from our model follows the same pattern and is
relatively close in value to that obtained from historical performance.
Figure 10. Average net annualized return comparison.