
Page 288 - Data Science Algorithms in a Week
P. 288
Agent-Based Modeling Simulation and Its Application to Ecommerce 269
System Dynamics
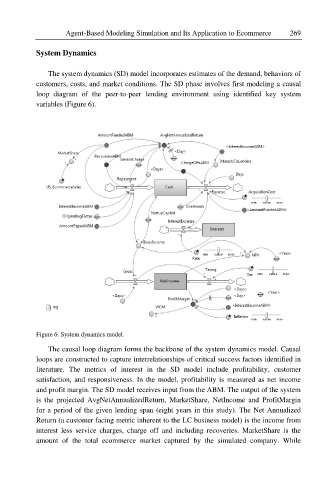
The system dynamics (SD) model incorporates estimates of the demand, behaviors of
customers, costs, and market conditions. The SD phase involves first modeling a causal
loop diagram of the peer-to-peer lending environment using identified key system
variables (Figure 6).
Figure 6. System dynamics model.
The causal loop diagram forms the backbone of the system dynamics model. Causal
loops are constructed to capture interrelationships of critical success factors identified in
literature. The metrics of interest in the SD model include profitability, customer
satisfaction, and responsiveness. In the model, profitability is measured as net income
and profit margin. The SD model receives input from the ABM. The output of the system
is the projected AvgNetAnnualizedReturn, MarketShare, NetIncome and ProfitMargin
for a period of the given lending span (eight years in this study). The Net Annualized
Return (a customer facing metric inherent to the LC business model) is the income from
interest less service charges, charge off and including recoveries. MarketShare is the
amount of the total ecommerce market captured by the simulated company. While