
Page 2 - Vibrations 3
P. 2
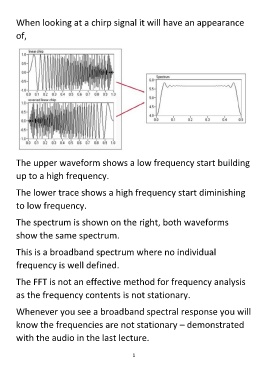
When looking at a chirp signal it will have an appearance


        of,


        The upper waveform shows a low frequency start building


        up to a high frequency.


        The lower trace shows a high frequency start diminishing


        to low frequency.


        The spectrum is shown on the right, both waveforms


        show the same spectrum.


        This is a broadband spectrum where no individual

        frequency is well defined.


        The FFT is not an effective method for frequency analysis

        as the frequency contents is not stationary.


        Whenever you see a broadband spectral response you will


        know the frequencies are not stationary – demonstrated

        with the audio in the last lecture.


                                                            1