
Page 62 - Prosig Catalogue 2005
P. 62
SOFTWARE PRODUCTS
UNDERSTANDING THE CROSS CORRELATION FUNCTION
1 and i.j = 1 * 1 * cos(90) = 0. Substituting these values we come to the
same formula Understanding The
r = x + y 2 Cross Correlation
2
2
Training & Support This can be extended to a tri-axial (x,y,z) configuration. For example, if we Function
The modulus or magnitude, r, of the resultant vector r at point P with
coordinates x and y is then given by
r = (x + y )
2 0.5
2
have three measurements x, y and z representing accelerations measured
To illustrate the use of the cross correlation function, a source location
by a tri-axial accelerometer in the x, y and z directions respectively then
the resultant vector r is given by
example is shown below. For this it is assumed that there is a noise source
at some unknown position between 2 microphones. A cross correlation
r = xi + yj + zk
where i, j and k are unit vectors in the x, y and z directions.
the location.
The magnitude, r, of the resultant vector is then the net acceleration and
To simulate the noise a broad band Gaussian signal was bandpass filtered
is given by technique and a transfer function like approach were used to determine
from 500 to 1500Hz. This random signal, s(t), was generated at 10000
r = (x + y + z ) samples/second. Two delayed signals, p1(t) and p2(t), were then formed.
2 0.5
2
2
Condition Monitoring as shown below. In this example x, y and z accelerations were captured Similarly p2(t) was formed with 14msec delay by ignoring the first 140
Assuming the speed of sound in air is 1000ft/second then p1(t) was
There is a particular module in the DATS software that takes a tri-axial
formed from s(t) with a 25 msec delay by ignoring the first 250 values.
group of signals (three signals) and generates the resultant magnitude
values. In order to represent dispersion and other specific path effects,
and analyzed to produce the magnitude of the resultant net acceleration.
two unrelated Gaussian broad band signals, n1(t) and n2(t), were also
generated, each with approximately 20% of the overall energy of the
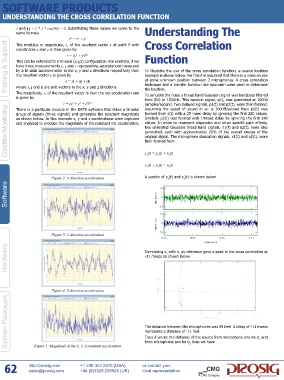
original signal. The microphone simulation signals, x1(t) and x2(t), were
then formed from
x (t) = p (t) + n (t)
1
1
1
x (t) = p (t) + n (t)
2 2 2
Figure 2: X direction acceleration A section of x (t) and x (t) is shown below
2
1
Software
Figure 3: Y direction acceleration
Hardware Correlating x with x as reference gave a peak in the cross correlation at
1
2
-11 msecs as shown below
Figure 4: Z direction acceleration
System Packages The distance between the microphones was 39 feet. A delay of -11 msecs
represents a distance of -11 feet.
Thus if we let the distance of the source from microphone one be d and
1
from microphone two be d then we have
2
Figure 5: Magnitude of the X, Y, Z resultant acceleration
62 http://prosig.com +1 248 443 2470 (USA) or contact your
+44 (0)1329 239925 (UK) local representative
sales@prosig.com
A CMG Company