
Page 14 - Vibrations 4
P. 14
Waterfall analysis
Use waterfall displays of octave data for an overview of
device noise versus time or RPM.
Display individual frequency bands as a function of RPM
or time using the slice marker function.
Alternatively, use trace markers to select individual traces
for display.
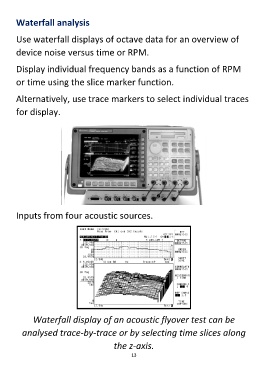
Inputs from four acoustic sources.
Waterfall display of an acoustic flyover test can be
analysed trace-by-trace or by selecting time slices along
the z-axis.
13