
Page 11 - Vibrations 4
P. 11
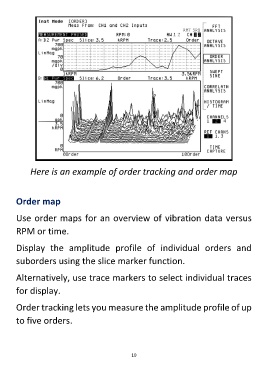
Here is an example of order tracking and order map


        Order map


        Use order maps for an overview of vibration data versus


        RPM or time.


        Display  the  amplitude  profile  of  individual  orders  and

        suborders using the slice marker function.


        Alternatively, use trace markers to select individual traces

        for display.


        Order tracking lets you measure the amplitude profile of up


        to five orders.


                                                           10