
Page 6 - Vibrations 4
P. 6
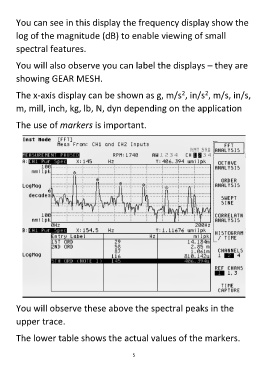
You can see in this display the frequency display show the


        log of the magnitude (dB) to enable viewing of small

        spectral features.


        You will also observe you can label the displays – they are


        showing GEAR MESH.


                                                                                            2
                                                                                  2
        The x-axis display can be shown as g, m/s , in/s , m/s, in/s,
        m, mill, inch, kg, lb, N, dyn depending on the application


        The use of markers is important.


        You will observe these above the spectral peaks in the


        upper trace.


        The lower table shows the actual values of the markers.


                                                            5