Page 53 - Banking Finance April 2018
P. 53

STATISTICS

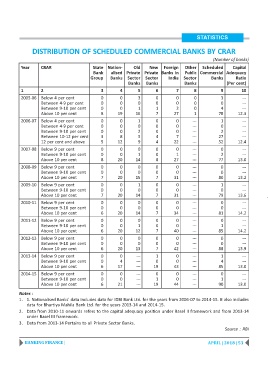
               DISTRIBUTION OF SCHEDULED COMMERCIAL BANKS BY CRAR

                                                                                                (Number of banks)
          Year     CRAR                   State Nation-     Old    New    Foreign  Other   Scheduled    Capital
                                          Bank    alised Private Private Banks in  Public Commercial Adequacy
                                         Group    Banks   Sector  Sector    India  Sector      Banks      Ratio
                                                          Banks   Banks            Banks              (Per cent)
          1        2                          3       4       5       6        7       8           9        10
          2005-06 Below 4 per cent            0       0       3       0        0       0           3         ---
                   Between 4-9 per cent       0       0       0       0        0       0           0         ---
                   Between 9-10 per cent      0       0       1       1        2       0           4         ---
                   Above 10 per cent          8      19      16       7       27       1          78       12.3
          2006-07 Below 4 per cent            0       0       1       0        0       ---         1         ---
                   Between 4-9 per cent       0       0       0       0        0       ---         0         ---
                   Between 9-10 per cent      0       0       2       0        0       ---         2         ---
                   Between 10-12 per cent     3       8       5       4        7       ---        27         ---
                   12 per cent and above      5      12       9       4       22       ---        52       12.4
          2007-08 Below 9 per cent            0       0       0       0        0       ---         0         ---
                   Between 9-10 per cent      0       0       1       0        1       ---         2         ---
                   Above 10 per cent          8      20      14       8       27       ---        77       13.0
          2008-09 Below 9 per cent            0       0       0       0        0       ---         0         ---
                   Between 9-10 per cent      0       0       0       0        0       ---         0         ---
                   Above 10 per cent          7      20      15       7       31       ---        80       13.2

          2009-10 Below 9 per cent            0       0       1       0        0       ---         1         ---
                   Between 9-10 per cent      0       0       0       0        0       ---         0         ---
                   Above 10 per cent          7      20      14       7       31       ---        79       13.6
          2010-11 Below 9 per cent            0       0       0       0        0       ---         0         ---
                   Between 9-10 per cent      0       0       0       0        0       ---         0         ---
                   Above 10 per cent          6      20      14       7       34       ---        81       14.2
          2011-12 Below 9 per cent            0       0       0       0        0       ---         0         ---
                   Between 9-10 per cent      0       0       1       0        0       ---         1         ---
                   Above 10 per cent          6      20      12       7       40       ---        85       14.2
          2012-13 Below 9 per cent            0       0       0       0        0       ---         0         ---
                   Between 9-10 per cent      0       0       0       0        0       ---         0         ---
                   Above 10 per cent          6      20      13       7       42       ---        88       13.9
          2013-14 Below 9 per cent            0       0       ---     1        0       ---         1         ---
                   Between 9-10 per cent      0       4       ---     0        0       ---         4         ---
                   Above 10 per cent          6      17       ---    19       43       ---        85       13.0
          2014-15 Below 9 per cent            0       0       ---     0        0       ---         0         ---
                   Between 9-10 per cent      0       0       ---     1        0       ---         1         ---
                   Above 10 per cent          6      21       ---    19       44       ---        90       13.0

          Notes :
          1. 1. Nationalised Banks' data includes data for IDBI Bank Ltd. for the years from 2006-07 to 2014-15. It also includes
             data for Bhartiya Mahila Bank Ltd. for the years 2013-14 and 2014-15.
          2. Data from 2010-11 onwards refers to the capital adequacy position under Basel II framework and from 2013-14
             under Basel III framework.
          3. Data from 2013-14 Pertains to all Private Sector Banks.
                                                                                                     Source : RBI


            BANKING FINANCE |                                                                APRIL | 2018 | 53
   48   49   50   51   52   53   54   55   56   57   58