
Page 54 - Banking Finance April 2018
P. 54
STATISTICS
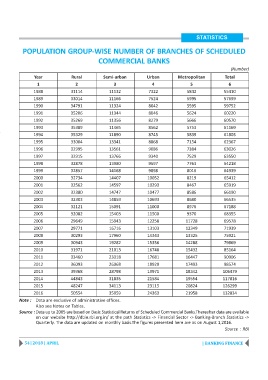
POPULATION GROUP-WISE NUMBER OF BRANCHES OF SCHEDULED
COMMERCIAL BANKS
(Number)
Year Rural Semi-urban Urban Metropolitan Total
1 2 3 4 5 6
1988 31114 11132 7322 5842 55410
1989 33014 11166 7524 5995 57699
1990 34791 11324 8042 5595 59752
1991 35206 11344 8046 5624 60220
1992 35269 11356 8279 5666 60570
1993 35389 11465 8562 5753 61169
1994 35329 11890 8745 5839 61803
1995 33004 13341 8868 7154 62367
1996 32995 13561 9086 7384 63026
1997 32915 13766 9340 7529 63550
1998 32878 13980 9597 7763 64218
1999 32857 14168 9898 8016 64939
2000 32734 14407 10052 8219 65412
2001 32562 14597 10293 8467 65919
2002 32380 14747 10477 8586 66190
2003 32303 14859 10693 8680 66535
2004 32121 15091 11000 8976 67188
2005 32082 15403 11500 9370 68355
2006 29649 15943 12258 11728 69578
2007 29771 16716 13103 12349 71939
2008 30293 17960 14343 13325 75921
2009 30943 19282 15356 14288 79869
2010 31971 21013 16748 15432 85164
2011 33460 23318 17681 16447 90906
2012 36093 26068 18920 17493 98574
2013 39368 28798 19971 18342 106479
2014 44843 31835 21584 19554 117816
2015 48247 34113 23115 20824 126299
2016 50554 35959 24363 21958 132834
Note : Data are exclusive of administrative offices.
Also see Notes on Tables.
Source :Data up to 2005 are based on Basic Statistical Returns of Scheduled Commercial Banks.Thereafter data are available
on our website http://dbie.rbi.org.in/ at the path Statistics -> Financial Sector -> Banking-Branch Statistics ->
Quarterly. The data are updated on monthly basis.The figures presented here are as on August 1,2016.
Source : RBI
54 | 2018 | APRIL | BANKING FINANCE