
Page 54 - Insurance Times July 2016
P. 54
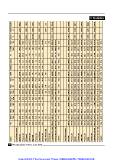
StatisticsInsurersFire Marine Marine Marine Engine- Motor MotorMotor Health Aviation LiabilityP.A. All Other Grand Growth Market Accretion
                                    Total Cargo Hull ering Total OD      TP
54 The Insurance Times, July 2016                                                                        Misc. Total %                  %

Private Sector Insurers

SBI General              615.35 22.20 22.20 0.00 18.72 707.94 429.99 277.95 215.58 0.03 3.75 301.20 155.07 2039.84 29.36% 2.12% 462.93

Previous year            514.69 17.51 17.51 0.00 23.49 538.65 287.21 251.44 99.40 0.58 3.37 287.55 91.67 1576.91

L&T General              60.16 14.46 14.46 0.00 19.25 299.97 201.49 98.48 65.74 0.00 6.29 2.81 3.03 471.71 42.20% 0.49% 140.00

Previous year            41.81 9.46 9.46 0.00 18.05 204.86 139.19 65.67 46.62 0.00 5.52 1.94 3.45 331.71

Magma HDI                29.13 12.39 12.39 0.00 9.28 334.49 175.99 158.50 0.00 0.00 15.04 1.77 1.83 403.93 -14.71% 0.42% -69.67

Previous year            29.78 10.81 10.81 0.00 9.96 401.19 225.78 175.41 0.00 0.00 1.89 1.34 18.63 473.60

Liberty Videocon         27.80 7.97 7.97 0.00 14.92 274.46 260.18 14.28 58.97 0.00 5.86 10.89 7.85 408.72 43.99% 0.42% 124.87

Previous year            19.41 3.67 3.67 0.00 7.25 192.15 152.66 39.49 36.95 0.00 3.77 17.11 3.55 283.85

Kotak Mahindra ($$$)     0.00  3.63 2.46 1.17 0.09                                                       3.72 0.00% 3.72

Previous year            0.00  0.00 0.00 0.00                                                            0.00

Private Sector Sub Total 3854.03 1249.74 1135.95 113.79 775.92 22569.97 13041.51 9528.46 5306.96 92.76 1086.81 1600.56 3155.75 39692.50 13.12% 41.18% 4602.46

Previous Year Sub Total 3277.20 1131.53 1039.44 92.09 739.08 19804.93 11730.21 8074.72 4670.29 86.08 590.11 1391.22 3399.59 35090.04

%Growth                  17.6% 10.4% 9.3% 23.6% 5.0% 14.0% 11.2% 18.0% 13.6% 7.8% 84.2% 15.0% -7.2% 13.1%

Public Sector Insurers

NewIndia                 1699.27 616.74 334.36 282.38 496.21 6182.23 2791.85 3390.38 4857.27 114.54 298.36 210.74 698.70 15174.06 14.87% 15.74% 1964.69

Previous year            1644.89 665.28 328.84 336.44 417.75 5366.01 2588.22 2777.79 3941.79 104.34 264.40 185.60 619.31 13209.37

National                 876.90 254.15 172.05 82.10 257.32 5784.18 2329.03 3455.15 3970.78 66.63 86.70 237.75 476.26 12010.67 6.84% 12.46% 768.77

Previous year            909.05 298.39 186.40 111.99 296.47 5122.36 2167.21 2955.15 3633.70 69.74 91.69 132.79 687.71 11241.90

UnitedIndia              1315.91 446.23 261.73 184.50 525.08 4723.27 1731.90 2991.37 4069.68 66.29 171.64 221.15 675.92 12215.17 14.25% 12.67% 1523.44

Previous year            1251.49 526.73 282.14 244.59 541.01 4169.17 1673.64 2495.53 3176.86 56.99 163.90 232.01 573.57 10691.73

Oriental                 982.29 420.38 222.50 197.88 318.05 3150.93 1273.98 1876.95 2595.77 97.26 125.37 144.45 483.15 8317.65 12.28% 8.63% 909.68

Previous year            958.12 397.95 224.84 173.11 342.02 2861.73 1217.76 1643.97 1994.68 100.61 122.06 126.41 504.39 7407.97

PublicSector subTotal 4874.37 1737.50 990.64 746.86 1596.66 19840.61 8126.76 11713.85 15493.50 344.72 682.07 814.09 2334.03 47717.55 12.14% 49.50% 5166.58

Previous Year Sub Total 4763.55 1888.35 1022.22 866.13 1597.25 17519.27 7646.83 9872.44 12747.03 331.68 642.05 676.81 2384.98 42550.97

%Growth                  2.3% -8.0% -3.1% -13.8% 0.0% 13.3% 6.3% 18.7% 21.5% 3.9% 6.2% 20.3% -2.1% 12.1%