
Page 489 - Insurance Statistics 2021
P. 489
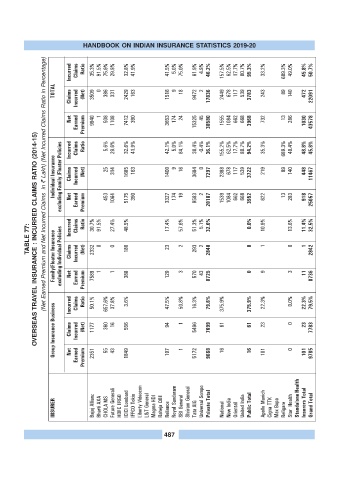
HANDBOOK ON INDIAN INSURANCE STATISTICS 2019-20

                 (Net Earned Premium and Net Incurred Claims  in ? Lakh) (Net Incurred Claims Ratio in Percentage)
                          Incurred  Claims  Ratio  35.3%  91.5%  75.9%  29.9%  32.8%  41.9%  41.5%  5.0%  75.0%  61.9%  4.9%  46.2%  157.5%  62.5%  17.7%  80.7%  95.3%  33.2%  689.3%  49.0%  45.8%  50.7%


                    TOTAL  Claims  Incurred  (Net)  3509  0  386  331  2429  163  1516  9  18  9472  2  17836  2449  678  117  539  3783  243  89  140  472  22091


                          Net  Earned  Premium  Ratio  9940  1  508  5.6%  1108  7412  390  3653  174  5.0%  24  15325  45  -0.4%  38580  1555  1084  662  668  3968  732  13  286  1030  43578


                    Individual Insurance excluding Family /Floater Policies  Incurred  Claims  Net  Claims  Incurred  Earned  (Net)  Premium  25  453  29.6%  314  1064  32.6%  1685  5175  41.9%  163  390  42.1%  1400  3327  9  174  84.1%  16  19  38.4%  3684  9583  0  2  36.1%  7297  20187  155.2%  2388  1539  62.5%  678  1084  17.7%  117  662  80.7%  539  668  94.2%  3722  3952  35.3%  219  622  689.3%  89  13  49.4%  140  283  48.8%  448  918  45.8%  11467  25057


           TABLE 77: OVERSEAS TRAVEL INSURANCE : INCURRED CLAIMS RATIO (2014-15)  Incurred  Claims  Ratio  30.7%  91.5%  0  27.4%  0  48.5%  17.4%  23  57.6%  2  51.3%  5.1%  2  32.6%  0.0%  0  10.9%  1  13.6%  0  11.4%  1  32.5%
                    Family/Floater Insurance excluding Individual Policies  Claims  Net  Incurred  Earned  (Net)  Premium  2332  7589  1  1  188  388  129  3  293  570  43  2840  8725  0  9  3  11  2842  8736


                    Group Insurance Business  Incurred  Claims  Net  Claims  Incurred  Earned  Ratio  (Net)  Premium  50.1%  1177  2351  657.6%  360  55  37.8%  16  43  3.6%  556  1849  47.5%  94  197  50.8%  1  1  16.3%  5496  5172  79.6%  7699  9668  375.9%  61  16  375.9%  61  16  22.3%  23  101  0.0%  0  0  22.3%  23  101  79.5%  7783  9785


                    INSURER       Bajaj Allianz  Bharti AXA  CHOLA MS  Future Generali  HDFC ERGO  ICICI Lombard  IFFCO Tokio  Liberty Videocon  L&T General  Magma HDI  Raheja QBE  Reliance  Royal Sundaram  SBI General  Shriram General  Tata AIG  Universal Sompo  Private Total  National  New India  Oriental  United India  Public Total  Apollo Munich  Cigna TTK  Max Bupa  Religare  Star  Health  Standalone Health  Insurers Total  Grand Total


                                                           487