
Page 491 - Insurance Statistics 2021
P. 491
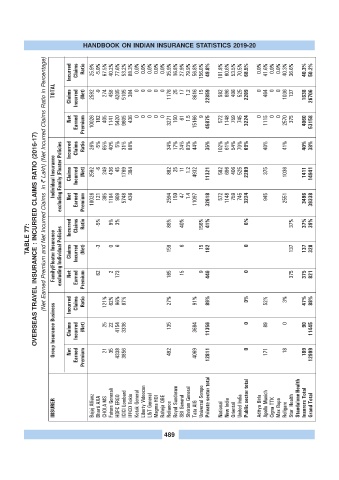
HANDBOOK ON INDIAN INSURANCE STATISTICS 2019-20

                 (Net Earned Premium and Net Incurred Claims  in ? Lakh) (Net Incurred Claims Ratio in Percentage)
                          Incurred  Claims  Ratio  25.9%  -5.0%  67.5%  40.2%  77.6%  53.2%  88.3%  0.0%  0.0%  0.0%  0.0%  0.0%  35.9%  16.8%  27.9%  79.9%  56.8%  156.0%  49.8%  101.8%  60.6%  53.5%  70.5%  68.5%  0.0%  41.6%  0.0%  0.0%  40.3%  36.6%  40.3%  50.2%


                    TOTAL  Claims  Incurred  (Net)  2592  -9  274  458  4205  5105  384  0  0  0  0  0  1176  25  17  1.2  8616  15  22859  582  696  406  525  2209  0  464  0  0  1036  137  1638  26706


                          Net  Earned  Premium  Ratio  10026  26%  182  -5%  405  65%  1141  40%  5420  5%  9605  31%  436  88%  0  0  0  0  0  3271  34%  150  17%  61  24%  1.5  83%  15166  44%  9  45875  35%  572  102%  1148  61%  759  54%  745  70%  3224  69%  0  1115  40%  0  0  2570  41%  375  4060  40%  53158  38%


                    Individual Insurance excluding Family /Floater Policies  Incurred  Claims  Net  Claims  Incurred  Earned  (Net)  Premium  2592  10026  -6  121  249  385  436  1104  45  909  1769  5748  384  436  882  2594  25  150  11  47  1.2  1.4  4932  11097  11321  32618  582  572  696  1148  406  759  525  745  2209  3224  375  945  1036  2551  1411  3496  14941  39338


           TABLE 77: OVERSEAS TRAVEL INSURANCE : INCURRED CLAIMS RATIO (2016-17)  Incurred  Claims  Ratio  -5%  -3  9%  0  3%  6  86%  40%  6  156%  15  41%  0%  0  37%  37%  39%
                    Family/Floater Insurance excluding Individual Policies  Claims  Net  Incurred  Earned  (Net)  Premium  62  2  173  159  185  15  9  182  446  0  137  375  137  375  320  821


                    Group Insurance Business  Incurred  Claims  Net  Claims  Incurred  Earned  Ratio  (Net)  Premium  121%  25  21  62%  22  35  96%  4154  4338  87%  3336  3856  27%  135  492  91%  3684  4069  89%  11356  12811  0%  0  0  52%  89  171  3%  0  18  47%  90  189  88%  11445  12999


                    INSURER       Bajaj Allianz  Bharti AXA  CHOLA MS  Future Generali  HDFC ERGO  ICICI Lombard  IFFCO Tokio  Kotak General  Liberty Videocon  L&T General  Magma HDI  Raheja QBE  Reliance  Royal Sundaram  SBI General  Shriram General  Tata AIG  Universal Sompo  Private sector total  National  New India  Oriental  United India  Public sector total  Aditya Birla  Apollo Munich  Cigna TTK  Max Bupa  Religare  Star  Health  Standalone Health  Insurers Total


                                                           489