
Page 490 - Insurance Statistics 2021
P. 490
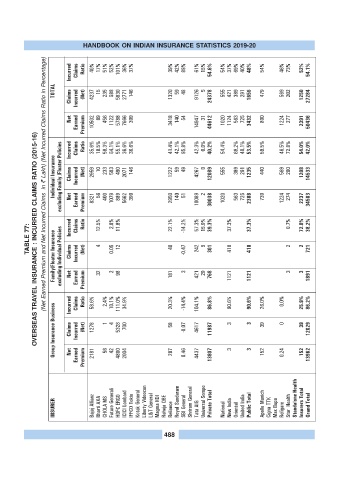
HANDBOOK ON INDIAN INSURANCE STATISTICS 2019-20

                 (Net Earned Premium and Net Incurred Claims  in ? Lakh) (Net Incurred Claims Ratio in Percentage)
                          Incurred  Claims  Ratio  40%  17%  51%  52%  101%  36%  37%  39%  42%  89%  61%  15%  54.6%  54%  37%  69%  40%  48%  54%  46%  73%  52%  54.1%


                    TOTAL  Claims  Incurred  (Net)  4237  15  235  588  5830  2771  146  1320  59  48  9126  5  24378  555  421  389  291  1656  479  569  202  1250  27284


                          Net  Earned  Premium  Ratio  10502  89  456  1122  5788  7666  399  3418  140  54  14947  31  0.0%  44612  1020  1124  563  725  3432  890  1224  277  2391  50436


                    Individual Insurance excluding Family /Floater Policies  Incurred  Claims  Net  Claims  Incurred  Earned  (Net)  Premium  35.6%  2959  8321  18.5%  10  56  58.3%  233  400  54.1%  583  1079  55.1%  490  889  36.6%  2071  5662  36.6%  146  399  41.4%  1222  2950  42.1%  59  140  95.8%  49  51  42.3%  4267  10089  0  2  40.2%  12089  30038  54.4%  555  1020  69.2%  389  563  40.1%  291  725  53.5%  1235  2308  59.5%  440  739  46.5%  569  1224  72.8%  20


           TABLE 77: OVERSEAS TRAVEL INSURANCE : INCURRED CLAIMS RATIO (2015-16)  Incurred  Claims  Ratio  12.5%  4  2.8%  11.8%  12  22.1%  40  -14.2%  57.3%  15.9%  5  39.3%  37.3%  37.3%  0.7%  2  72.8%  2  38.2%
                    Family/Floater Insurance excluding Individual Policies  Claims  Net  Incurred  Earned  (Net)  Premium  32  0.05  2  98  181  -0.47  3  242  421  29  301  768  418  1121  418  1121  3  3  721  1891


                    Group Insurance Business  Incurred  Claims  Net  Claims  Incurred  Earned  Ratio  (Net)  Premium  58.6%  1278  2181  2.4%  1  56  10.1%  4  42  111.0%  5328  4800  34.9%  700  2004  20.3%  58  287  -14.4%  -0.07   0.46  104.1%  4617  4437  86.8%  11987  13807  90.6%  3  3  90.6%  3  3  26.0%  39  152  0.0%  0  0.24  25.9%  39  152  86.2%  12029  13962


                    INSURER       Bajaj Allianz  Bharti AXA  CHOLA MS  Future Generali  HDFC ERGO  ICICI Lombard  IFFCO Tokio  Kotak General  Liberty Videocon  L&T General  Magma HDI  Raheja QBE  Reliance  Royal Sundaram  SBI General  Shriram General  Tata AIG  Universal Sompo  Private Total  National  New India  Oriental  United India  Public Total  Apollo Munich  Cigna TTK  Max Bupa  Religare  Star  Health  Standalone Health  Insurers Total  Grand Total


                                                           488