
Page 542 - Insurance Statistics 2021
P. 542
HANDBOOK ON INDIAN INSURANCE STATISTICS 2019-20
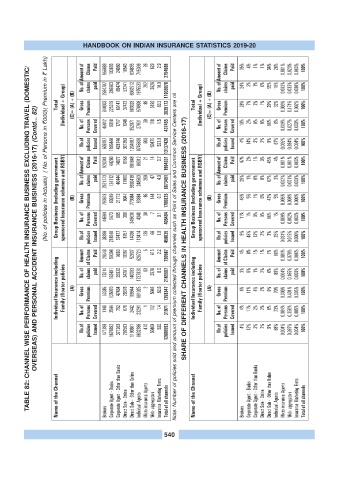
(No. of policies in Actuals) ( No. of Persons in '000)( Premium in r Lakh)
Amount of No. of Claims claims Paid paid 956889 103655 286603 24960 65474 18543 52241 934855 715036 26 292 629 3626 2.9 10.0 2754598 Amount of No. of Claims claims Paid paid 35% 24% 4% 3% 1% 1% 1% 0% 34% 55% 26% 18% 0.001% 0.003% 0.023% 0.033% 0.000% 0.000% 100% 100%
TABLE 82: CHANNEL WISE PERFORMANCE OF HEALTH INSURANCE BUSINESS EXCLUDING TRAVEL (DOMESTIC/
(Individual + Group) (C)= (A) + (B) 2594787 6060512 1975533 89 5192 63.3 11039078 (Individual + Group) (C)= (A) + (B) 28% 7% 2% 1% 29% 32%
Total Gross Premium 844003 45812 225319 9018 69147 1717 37423 1048 883028 974908 27631 39 118 1.5 3039172 Total Gross Premium 10% 2% 0% 0% 80% 6% 0.003% 0.171% 0.002% 100% 100%
OVERSEAS) AND PERSONAL ACCIDENT INSURANCE BUISINESS (2016-17) (Contd... 82)
No.of No. of Amount of Persons policies Claims Covered Issued Paid 509797 928341 1895440 44260 428740 14977 301350 8156 352071 1204697 881948 8745800 86312 608 21 50475 14 521.0 0.7 437455 13137428 1964031 No. of No.of Amount of Persons policies Claims Covered Issued Paid 4% 47% 14% 2% 3% 1% 2% 0% 9% 45% 67% 4% 0.009% 0.005% 0.001% 0.027% 0.384% 0.001% 0.000% 0.004% 0.000% 100% 100%
Group Business (Including government sponsored Insurance schemes and RSBY) (B) No. of Gross No. of claims Premium Persons paid Covered 2521773 793618 44664 124112 90249 5473 40444 21713 965 17980 8047 368 5920419 773084 349630 248503 93884 4340 209 86 38 47 144 7 4.0 0.7 0.1 8873491 1780825 405484 Group Business (Including government sponsored Insurance schemes and RSBY) (B) No. of Gross No. of claims Prem
Amount No.of policies of Claims Issued Paid paid 38398 28548 218548 59394 57477 9983 8757 10387 14036 52907 113414 628723 138 5 83 66 615 3579 1.0 2.2 6.0 450835 790567 Note: Number of policies sold and amount of premium collected through channels such as Point of Sales and Common Service Centers are nil SHARE OF DIFFERENT CHANNELS IN HEALTH INSURANCE BUSINESS (2016-17) No.of Amount policies of Claims Issued
Individual Insurance including Family /floater policies (A) No. of Gross claims Premium 73014 50385 162491 135070 25030 47434 752 34261 29376 679 140093 109944 1727030 881025 2 1 5048 112 62.6 1.4 2165587 1258347 Individual Insurance including Family /floater policies (A) No. of Gross claims Premium 4% 4% 11% 11% 4% 2% 2% 2% 9% 8% 70% 73% 0.004% 0.000% 0.165% 0.401% 0.000% 0.005% 100% 100%
No.of No. of Persons policies Covered Issued 1148 471399 3544 1676892 371263 292593 2442 1190661 23291 8632386 470 50409 520 31971 12686593 No. of No.of Persons policies Covered Issued 4% 13% 3% 2% 9% 68% 0.004% 0.004% 0.350% 0.397% 0.005% 0.004% 100% 100%
Name of the Channel Brokers Corporate Agent - Banks Corporate Agent - Other than Banks Direct Sale - Online Direct Sale - Other than Online Individual Agents Micro-insurance Agents Web- aggregators Insurance Marketing Firms Total of all channels Name of the Channel Brokers Corporate Agent - Banks Corporate Agent - Other than Banks Direct Sale - Online Direct Sale - Other than Online Individual Agents Micro-insurance Agents Web- ag
540