
Page 546 - Insurance Statistics 2021
P. 546
HANDBOOK ON INDIAN INSURANCE STATISTICS 2019-20
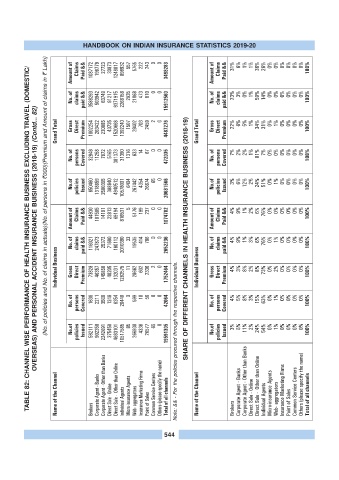
(No. of policies and No. of claims in actuals)(No. of persons in '000)(Premium and Amount of claims in ? Lakh)
Amount of Claims Paid && 1087172 198779 27723 30873 1248017 898932 557 5765 222 243 0 0 3498283 Amount of Claims Paid && 31% 6% 1% 1% 36% 26% 0% 0% 0% 0% 0% 0% 100%
TABLE 82: CHANNEL WISE PERFORMANCE OF HEALTH INSURANCE BUSINESS EXCLUDING TRAVEL (DOMESTIC/
No. of claims paid && 3588293 503942 63749 91217 9371915 2268158 2935 21068 473 810 0 0 15912560 No. of claims paid && 23% 3% 0% 1% 59% 14% 0% 0% 0% 0% 0% 0% 100%
OVERSEAS) AND PERSONAL ACCIDENT INSURANCE BUISINESS (2018-19) (Contd... 82)
Grand Total Gross Direct Premium 1002254 263422 230885 43735 1520668 1392240 1507 29402 703 2459 2 0 4487276 Grand Total Gross Direct Premium 22% 6% 5% 1% 34% 31% 0% 1% 0% 0% 0% 0% 100%
No. of persons Covered 32946 11258 7872 5165 381373 31390 1316 633 14 67 0 0 472035 No. of persons Covered 7% 2% 2% 1% 81% 7% 0% 0% 0% 0% 0% 0% 100%
No.of policies Issued 650460 1318659 2500355 388640 4940512 10578001 6404 267442 4354 26674 65 0 20681566 No.of policies Issued 3% 6% 12% 2% 24% 51% 0% 1% 0% 0% 0% 0% 100%
Amount of Claims Paid && 44930 101505 14191 22813 69194 816531 5 5176 199 237 0 0 1074782 Amount of Claims Paid && 4% 9% 1% 2% 6% 76% 0% 0% 0% 0% 0% 0% 100%
No. of claims paid && 116021 247873 25372 71690 160112 2010390 33 19535 414 796 0 0 2652236 SHARE OF DIFFERENT CHANNELS IN HEALTH INSURANCE BUSINESS (2018-19) No. of claims paid && 4% 9% 1% 3% 6% 76% 0% 1% 0% 0% 0% 0% 100%
Individual Business Gross Direct Premium 73828 46357 145856 40205 132031 1282575 11 28662 602 2336 2 0 1752464 Individual Business Gross Direct Premium 4% 3% 8% 2% 8% 73% 0% 2% 0% 0% 0% 0% 100%
No. of persons Covered 1638 2211 3508 1246 6354 26440 0 599 10 56 0 0 42064 No. of persons Covered 4% 5% 8% 3% 15% 63% 0% 1% 0% 0% 0% 0% 100%
No.of policies Issued 592111 902358 2242691 375458 4663101 10517585 85 266938 4336 26577 65 0 19591305 Note: && - For the policies procured through the respective channels. No.of policies Issued 3% 5% 11% 2% 24% 54% 0% 1% 0% 0% 0% 0% 100%
Name of the Channel Brokers Corporate Agent - Banks Corporate Agent - Other than Banks Direct Sale - Online Direct Sale - Other than Online Individual Agents Micro-insurance Agents Web- aggregators Insurance Marketing Firms Point of Sales Common Service Centers Others (please specify the name) Total of all channels Name of the Channel Brokers Corporate Agent - Banks Corporate Agent - Other than Banks Direct Sale - Online Direct Sale -
544