
Page 544 - Insurance Statistics 2021
P. 544
HANDBOOK ON INDIAN INSURANCE STATISTICS 2019-20
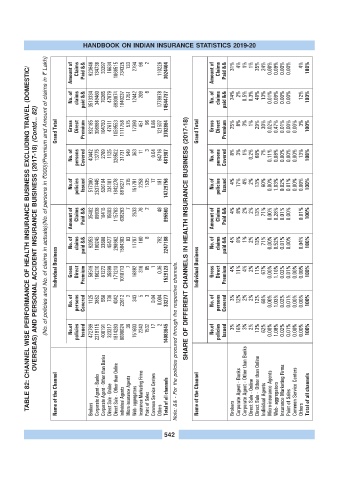
(No. of policies and No. of claims in actuals)(No. of persons in '000)(Premium and Amount of claims in ? Lakh)
Amount of Claims Paid && 923646 134738 33297 16634 1068515 734325 133 2794 96 2 110226 3024404 Amount of Claims Paid && 31% 4% 1% 1% 35% 24% 0.00% 0.09% 0.00% 0.00% 4% 100%
TABLE 82: CHANNEL WISE PERFORMANCE OF HEALTH INSURANCE BUSINESS EXCLUDING TRAVEL (DOMESTIC/
No. of claims paid && 3513334 349460 70265 47879 6930674 1840237 1251 12442 209 8 1778978 14544737 No. of claims paid && 24% 2% 0.5% 0.3% 48% 13% 0.01% 0.09% 0.00% 0.00% 12% 100%
OVERSEAS) AND PERSONAL ACCIDENT INSURANCE BUISINESS (2017-18) (Contd... 82)
Grand Total Gross Direct Premium 932185 306986 104750 47611 1059553 1111758 575 17390 451 96 0.66 121507 3702864 Grand Total Gross Direct Premium 25% 8% 3% 1% 29% 30% 0.02% 0.47% 0.01% 0.00% 0.00% 3% 100%
No. of persons Covered 40442 13775 2769 1125 326502 31731 549 363 11 3 0.04 64716 481987 No. of persons Covered 8% 3% 1% 0.2% 68% 7% 0.11% 0.08% 0.00% 0.00% 0.00% 13% 100%
No.of policies Issued 517380 2537445 526184 334101 1842278 8816271 315 151791 2258 1535 17 181 14729756 No.of policies Issued 4% 17% 4% 2% 13% 60% 0.00% 1.03% 0.02% 0.01% 0.00% 0.00% 100%
Amount of Claims Paid && 35402 69938 18415 15083 115763 638293 7 2533 76 2 49 895560 Amount of Claims Paid && 4% 8% 2% 2% 13% 71% 0.00% 0.28% 0.01% 0.00% 0.01% 100%
No. of claims paid && 92053 180245 33608 45477 298662 1584303 83 11797 160 8 792 2247188 SHARE OF DIFFERENT CHANNELS IN HEALTH INSURANCE BUSINESS (2017-18) No. of claims paid && 4% 8% 1% 2% 13% 71% 0.00% 0.52% 0.01% 0.00% 0.04% 100%
Individual Business Gross Direct Premium 58519 166210 61272 35899 171210 1018713 7 16892 316 85 1 0.36 1529123 Individual Business Gross Direct Premium 4% 11% 4% 2% 11% 67% 0.00% 1.10% 0.02% 0.01% 0.00% 0.00% 100%
No. of persons Covered 1125 3852 556 738 4042 22612 2 343 5 3 0.04 0.004 33277 No. of persons Covered 3% 12% 2% 2% 12% 68% 0.00% 1.03% 0.02% 0.01% 0.00% 0.00% 100%
No.of policies Issued 472799 2219115 400191 323217 1814263 8698624 39 151603 2243 1532 17 2 14083645 Note: && - For the policies procured through the respective channels. No.of policies Issued 3% 16% 3% 2% 13% 62% 0.00% 1.08% 0.02% 0.01% 0.00% 0.00% 100%
Name of the Channel Brokers Corporate Agent - Banks Corporate Agent - Other than Banks Direct Sale - Online Direct Sale - Other than Online Individual Agents Micro-insurance Agents Web- aggregators Insurance Marketing Firms Point of Sales Common Service Centers Others Total of all channels Name of the Channel Brokers Corporate Agent - Banks Corporate Agent - Other than Banks Direct Sale - Online Direct Sale - Other than Online Indivi
542