
Page 568 - Insurance Statistics 2021
P. 568
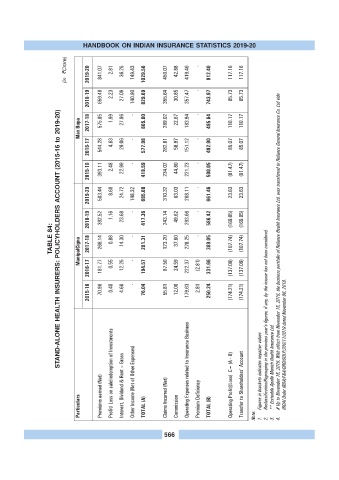
HANDBOOK ON INDIAN INSURANCE STATISTICS 2019-20

                        (in  ?Crore)  2019-20  841.07  2.81  36.25  149.43  1029.56  450.07  42.88  419.46   -  912.40  117.16  117.16


                                2018-19  659.48  2.23  27.09  140.90  829.69  355.64  30.85  357.47   -  743.97  85.73  85.73


                             Max Bupa  2017-18  575.85  1.99  27.96   -  605.80  289.02  22.67  183.94   -  495.64  110.17  110.17


                                2016-17  544.28  4.63  29.06   -  577.98  282.81  58.97  151.12   -  492.90  85.07  85.07


                                2015-16  393.11  2.48  22.99   -  418.59  234.02  44.80  221.23   -  500.05  (81.47)  (81.47)


                                2019-20  503.44  8.60  24.72  148.32  685.08  310.32  63.03  288.11   -  661.46  23.63  23.63


                                2018-19  392.52  1.16  23.68   -  417.36  243.14  49.62  293.66   -  586.42  (169.05)  (169.05)

                   TABLE 84: STAND-ALONE HEALTH INSURERS: POLICYHOLDERS ACCOUNT (2015-16 to 2019-20)  ManipalCigna  2017-18  266.14  0.88  14.30   -  281.31  123.20  37.60  228.25   -  389.05  (107.74)  (107.74) # Up to November 15, 2019. With effect from November 15, 2019, the business portfolio of Reliance Health Insurance Ltd. was transferred to Reliance General Insurance Co. Ltd vide


                                2016-17  181.77  0.55  12.25   -  194.57  87.50  24.59  222.37  (2.81)  331.66  (137.09)  (137.09)


                                2015-16  70.96  0.40  4.68   -  76.04  55.81  12.00  179.63  2.81  250.24  (174.21)  (174.21) Reclassification/Regrouping in the previous year's figures, if any, by the insurer has not been considered.


                                         Profit/ Loss on sale/redemption of Investments  Interest, Dividend & Rent – Gross  Other Income (Net of Other Expenses)  Operating Expenses related to Insurance Business  Operating Profit/(Loss)  C= (A - B)  Transfer to Shareholders’ Account  Figures in brackets indicates negative values ** Erstwhile Apollo Munich Health Insurance Ltd. IRDAI Order IRDA/F&A/ORD/SOLP/200/11/2019 dated November 06, 2019.


                             Particulars  Premiums earned (Net)  TOTAL (A)  Claims Incurred (Net)  Commission  Premium Deficiency  TOTAL (B)  Note:  1.  2.  3.  4.


                                                           566