
Page 572 - Insurance Statistics 2021
P. 572
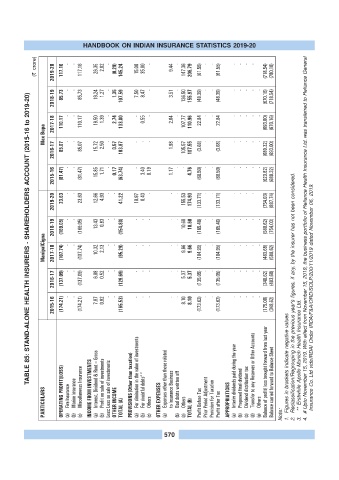
HANDBOOK ON INDIAN INSURANCE STATISTICS 2019-20

              (? crore)  2019-20   117.16   -   -   117.16   26.35   2.02   -   (0.29)   145.24   15.00   35.00   -   9.44   -   147.36   206.79   (61.55)   -   -   (61.55)   -   -   -   -   (718.54)   (780.10)


                    2018-19   85.73   -   -   85.73   19.24   1.27   -   1.35   107.59   7.50   8.47   -   3.51   -   136.50   155.97   (48.39)   -   -   (48.39)   -   -   -   -   -   (670.16)   (718.54)
           TABLE 85: STAND-ALONE HEALTH INSURERS - SHAREHOLDERS ACCOUNT (2015-16 to 2019-20)


                    2017-18   110.17   -   -   110.17   19.50   1.39   -   2.74   133.80   -   0.55   -   2.64   -   107.77   110.96   22.84   -   -   22.84   -   -   -   -   -   (693.00)   (670.16)
                 Max Bupa   -   -        -         -   -   -     -         -   -     -   -   -   -   -


                    2016-17   85.07   85.07   15.72   2.50   0.57   103.87   1.98   105.57   107.55   (3.68)   (3.68)   (689.32)   (693.00)


                    2015-16   (81.47)   -   -   (81.47)   15.85   1.71   -   0.17   (63.74)   -   3.40   0.19   1.17   -   -   4.76   (68.50)   -   -   (68.50)   -   -   -   -   -   (620.82)   (689.32)


                    2019-20   23.63   -   -   23.63   12.66   4.93   -   -   41.22   18.97   0.43   -   -   -   155.53   174.93   (133.71)   -   -   (133.71)   -   -   -   -   (754.03)   (887.74)


                    2018-19   (169.05)   -   -   (169.05)   13.43   0.83   -   -   (154.80)   -   -   -   -   -   10.60   10.60   (165.40)   -   -   (165.40)   -   -   -   -   -   (588.62)   (754.03)

                 ManipalCigna  2017-18   (107.74)   -   -   (107.74)   10.32   2.13   -   -   (95.29)   -   -   -   -   -   9.66   9.66   (104.95)   -   -   (104.95)   -   -   -   -   -   (483.68)   (588.62) 4.  # Upto November 15, 2019. With effect from November 15, 2019, the business portfolio of Reliance Health Insurance Ltd. was transferred to Reliance General


                    2016-17   (137.09)   -   -   (137.09)   6.88   0.52   -   -   (129.69)   -   -   -   -   -   5.37   5.37   (135.05)   -   -   (135.05)   -   -   -   -   -   (348.62)   (483.68)


                    2015-16   (174.21)   -   -   (174.21)   7.87   0.82   -   -   (165.53)   -   -   -   -   -   8.10   8.10   (173.62)   -   -   (173.62)   -   -   -   -   -   (175.00)   (348.62) 2.  Reclassification/Regrouping in the previous year's figures, if any, by the insurer has not been considered. Insurance Co. Ltd videIRDAI Order IRDA/F&A/ORD/SOLP/200/11/2019 dated November 06, 2019.


                 PARTICULARS  OPERATING PROFIT/(LOSS)  Fire Insurance  (a)  Marine Insurance  (b)  Miscellaneous Insurance  (c)  INCOME FROM INVESTMENTS Interest, Dividend & Rent – Gross  (a)  Profit on sale of investments  (b) Less: Loss on sale of investments  OTHER INCOME  TOTAL (A)  PROVISIONS (Other than taxation) For diminution in the value of investments  (a)  For doubtful debts“ "  (b)  Others  (c)  OTHER EXPENSES Expenses other than those related  (a)  to Insuran


                                                           570                                             3.