
Page 576 - Insurance Statistics 2021
P. 576
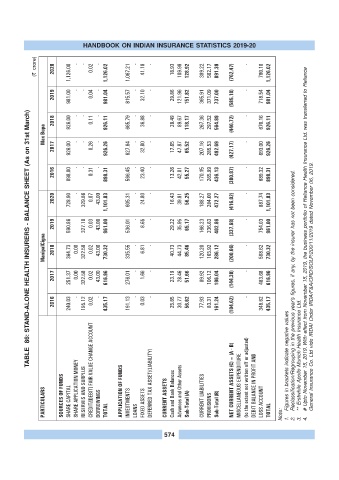
HANDBOOK ON INDIAN INSURANCE STATISTICS 2019-20

              (? crore)  2020   1,126.00   -   -   0.02   -   1,126.02   1,067.21   -   41.18   -   18.93   109.99   128.92   389.22   502.17   891.39   (762.47)   -   780.10   1,126.02


                    2019   981.00   -   -   0.04   -   981.04   815.57   -   32.10   -   29.86   121.96   151.82   365.91   371.09   737.00   (585.18)   -   718.54   981.04


           TABLE  86: STAND-ALONE HEALTH INSURERS - BALANCE SHEET (As on 31st March)
                    2018   926.00   -   -   0.11   -   926.11   665.79   -   36.88   -   28.49   89.67   118.17   267.36   297.52   564.89   (446.72)   -   670.16   926.11
                 Max Bupa


                    2017   926.00   -   -   0.26   -   926.26   627.64   -   32.80   -   17.65   47.87   65.52   207.16   285.53   492.69   (427.17)   -   693.00   926.26


                    2016   898.00   -   -   0.31   -   898.31   566.45   -   23.40   -   13.26   42.01   55.27   170.15   265.99   436.13   (380.87)   -   689.32   898.31


                    2020   728.90   -   329.86   0.07   43.00   1,101.83   605.31   -   24.80   -   16.43   39.81   56.25   188.27   284.00   472.27   (416.02)   -   887.74   1,101.83


                    2019   590.86   327.10   0.03   43.00   961.00   536.01   -   8.65   -   29.22   35.95   65.17   166.23   236.63   402.86   (337.68)   -   754.03   961.00

                 ManipalCigna  2018   364.73   0.00   322.58   0.02   43.00   730.32   335.55   -   6.81   -   40.73   44.73   85.46   120.20   165.92   286.12   (200.66)   -   588.62   730.32 # Upto November 15, 2019. With effect from November 15, 2019, the business portfolio of Reliance Health Insurance Ltd. was transferred to Reliance


                    2017   251.37   0.00   322.58   0.02   43.00   616.96   276.01   -   1.66   -   23.19   28.46   51.66   89.92   106.12   196.04   (144.38)   -   483.68   616.96 General Insurance Co. Ltd vide IRDAI Order IRDA/F&A/ORD/SOLP/200/11/2019 dated November 06, 2019.


                    2016   240.03   -   195.12   0.02   -   435.17   191.13   -   0.03   -   25.85   30.77   56.62   77.93   83.31   161.24   (104.62)   -   348.62   435.17 Reclassification/Regrouping in the previous year's figures, if any, by the insurer has not been considered.


                 PARTICULARS  SOURCES OF FUNDS  SHARE CAPITAL SHARE APPLICATION MONEY  RESERVES AND SURPLUS CREDIT/[DEBIT] FAIR VALUE CHANGE ACCOUNT  BORROWINGS  TOTAL  APPLICATION OF FUNDS  INVESTMENTS  LOANS  FIXED ASSETS DEFERRED TAX ASSET/(LIABILITY)  CURRENT ASSETS  Cash and Bank Balances  Advances and Other Assets  Sub-Total (A)  CURRENT LIABILITIES  PROVISIONS  Sub-Total (B)  NET CURRENT ASSETS (C) = (A - B) MISCELLANEOUS EXPENDITURE (to the extent not written off


                                                           574                                        1.  2.  3.  4.