
Page 578 - Insurance Statistics 2021
P. 578
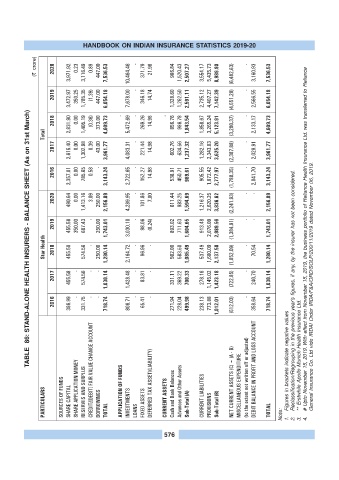
HANDBOOK ON INDIAN INSURANCE STATISTICS 2019-20

              (? crore)  2020   3,971.92   0.23   3,116.49   0.89   447.00   7,536.53   10,464.46   -   371.79   21.98   986.84   1,520.43   2,507.27   3,554.17   5,435.73   8,989.90   (6,482.63)   -   3,160.93   7,536.53


                    2019   3,472.97   350.25   1,785.35   (1.39)   447.00   6,054.18   7,678.00   -   346.18   14.74   1,328.60   1,262.50   2,591.11   2,735.12   4,407.27   7,142.39   (4,551.28)   -   2,566.55   6,054.18


           TABLE  86: STAND-ALONE HEALTH INSURERS - BALANCE SHEET (As on 31st March)
                    2018   2,831.90   0.00   1,405.19   (0.36)   373.00   4,609.73   -   5,472.69   -   269.26   14.98   -   856.76   986.78   1,843.54   1,858.67   3,265.24   5,123.91   (3,280.37)   -   2,133.17   4,609.73

                 Total

                    2017   2,615.40   0.00   1,302.98   0.39   43.00   3,961.77   4,083.31   -   221.44   14.98   602.76   634.56   1,237.32   1,282.16   2,343.03   3,625.20   (2,387.88)   -   2,029.91   3,961.77


                    2016   2,357.01   0.00   785.65   0.58   -   3,143.24   2,722.65   -   152.27   14.98   538.91   450.71   989.61   905.55   1,872.42   2,777.97   (1,788.35)   -   2,041.70   3,143.24


                    2020   490.64   0.00   1,413.16   3.09   250.00   2,156.89   4,289.95   -   101.86   7.00   611.44   983.25   1,594.69   1,216.37   2,620.25   3,836.62   (2,241.93)   -   -   2,156.89


                    2019   455.58   350.00   687.43   -   250.00   1,743.01   3,030.10   -   98.06   (0.24)   893.02   711.63   1,604.65   913.48   2,076.09   2,989.56   (1,384.91)   -   -   1,743.01


                  Star Health  2018   455.58   574.56   -   250.00   1,280.14   2,164.72   -   96.96   -   502.00   583.50   1,085.49   537.49   1,600.09   2,137.58   (1,052.09)   -   70.54   1,280.14 # Upto November 15, 2019. With effect from November 15, 2019, the business portfolio of Reliance Health Insurance Ltd. was transferred to Reliance


                    2017   455.58   -   574.56   -   -   1,030.14   1,428.48   -   83.81   -   331.11   369.22   700.33   278.16   1,145.02   1,423.18   (722.85)   -   240.70   1,030.14 General Insurance Co. Ltd vide IRDAI Order IRDA/F&A/ORD/SOLP/200/11/2019 dated November 06, 2019.


                    2016   386.99   -   331.75   -   -   718.74   806.71   -   65.41   -   271.94   228.04   499.98   238.13   773.88   1,012.01   (512.03)   -   358.64   718.74 Reclassification/Regrouping in the previous year's figures, if any, by the insurer has not been considered.


                 PARTICULARS  SOURCES OF FUNDS  SHARE CAPITAL SHARE APPLICATION MONEY  RESERVES AND SURPLUS CREDIT/[DEBIT] FAIR VALUE CHANGE ACCOUNT  BORROWINGS  TOTAL  APPLICATION OF FUNDS  INVESTMENTS  LOANS  FIXED ASSETS DEFERRED TAX ASSET/(LIABILITY)  CURRENT ASSETS  Cash and Bank Balances  Advances and Other Assets  Sub-Total (A)  CURRENT LIABILITIES  PROVISIONS  Sub-Total (B)  NET CURRENT ASSETS (C) = (A - B) MISCELLANEOUS EXPENDITURE (to the extent not written off


                                                           576                                        1.  2.  3.  4.