
Page 624 - Insurance Statistics 2021
P. 624
HANDBOOK ON INDIAN INSURANCE STATISTICS 2019-20
(? Crore) 2019-20 (808.57) (539.42) 400.40 28.70 (698.25) 907.05 402.71 0.00 121.49 622.67 858.94 131.71 0.00 0.00 0.35 0.00 77.63 1068.64 (445.97) (86.88) (359.09) 0.00 1184.22 243.43 0.00 4030.33 2243.59
2018-19 2421.21 (1170.82) 350.96 (79.53) 3320.59 1056.29 520.06 0.00 91.43 4088.99 0.00 479.70 101.79 0.00 0.00 0.02 0.00 73.66 655.17 3433.82 1209.52 2224.31 0.00 0.00 1184.22 243.43 0.00 3233.68 4030.33
TOTAL 2017-18 2330.72 110.56 559.57 (9.31) 1669.90 0.00 991.16 536.03 5.27 49.32 3901.96 0.00 40.20 87.50 0.00 0.00 19.27 0.00 63.10 210.07 3691.89 440.85 3251.04 0.00 1002.00 203.99 1924.18 3133.32 3254.20
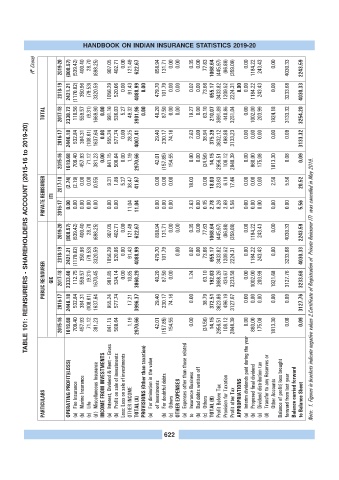
TABLE 101: REINSURERS - SHAREHOLDERS ACCOUNT (2015-16 to 2019-20)
2016-17 2446.18 532.84 384.31 (108.61) 1637.64 0.00 955.24 577.74 0.00 28.25 4007.41 29.40 230.17 74.16 2.63 0.00 38.94 375.29 3632.12 498.88 3133.23 0.00 0.00 0.00 0.00 0.09 3133.32
2015-16 1619.68 709.40 457.93 71.12 381.23 0.00 841.15 508.64 0.00 1.19 2970.66 42.01 (157.85) 154.55 0.00 0.00 (24.56) 14.15 2956.51 108.12 2848.39 0.00 860.00 175.08 1813.30 0.08 0.09
PRIVATE REINSURER ITI 2017-18 2016-17 (2.74) 0.00 (2.19) 0.00 0.00 0.00 0.00 0.00 (0.55) 0.00 9.31 0.00 1.89 0.00 5.27 38.47 11.04 41.67 11.04 0.00 0.00 0.00 0.00 0.00 0.00 18.03 2.63 0.00 0.00 0.15 18.03 2.78 23.63 8.26 6.18 2.69 17.46 5.56 0.00 0.00 0.00 0.00 0.00 0.00 2.50 0.00 5.56 0.00 20.52 5.56
2019-20 (808.57) (539.42) 400.40 28.70 (698.25) 907.05 402.71 0.00 121.49 622.67 858.94 131.71 0.00 0.00 0.35 0.00 77.63 1068.64 (445.97) (86.88) (359.09) 0.00 1184.22 243.43 0.00 4030.33 2243.59 2.Certificate of Registration of Private Reinsurer ITI was cancelled in May 2019.
2018-19 2421.21 (1170.82) 350.96 (79.53) 3320.59 1056.29 520.06 0.00 91.43 4088.99 479.70 101.79 0.00 0.02 0.00 73.66 655.17 3433.82 1209.52 2224.31 0.00 1184.22 243.43 0.00 3233.68 4030.33
PUBLIC REINSURER GIC 2017-18 2333.46 112.75 559.57 (9.31) 1670.45 981.85 534.14 0.00 10.85 3860.29 40.20 87.50 0.00 1.24 63.10 192.03 3668.26 434.67 3233.58 0.00 1002.00 203.99 1921.68 3127.76 3233.68
2016-17 2446.18 532.84 384.31 (108.61) 1637.64 955.24 577.74 17.21 3996.37 29.40 230.17 74.16 0.00 38.79 372.51 3623.86 496.19 3127.67 0.00 0.00 0.00 0.00 0.09 3127.76
2015-16 1619.68 709.40 457.93 71.12 381.23 841.15 508.64 1.19 2970.66 42.01 (157.85) 154.55 0.00 (24.56) 14.15 2956.51 108.12 2848.39 0.00 860.00 175.08 1813.30 0.08 0.09
OPERATING PROFIT/(LOSS) Fire Insurance Marine Insurance Miscellaneous Insurance INCOME FROM INVESTMENTS Interest, Dividend & Rent – Gross Profit on sale of investments Less: Loss on sale of investments PROVISIONS (Other than taxation) For diminution in the value of investments For doubtful debts Expenses other than those related Insurance Business Bad debts written off Interim dividends paid during the year Proposed final dividend Di
PARTICULARS (a) (b) Life (c) (d ) (a) (b) OTHER INCOME TOTAL (A) (a) (b) Others (c) OTHER EXPENSES (a) to (b) Others (c) TOTAL (B) Profit Before Tax Provision for Taxation Profit after Tax APPROPRIATIONS (a) (b) (c) (d) to Balance Sheet
622