
Page 720 - Insurance Statistics 2021
P. 720
Indian Non-life Insurance Industry
Yearbook 2018-19
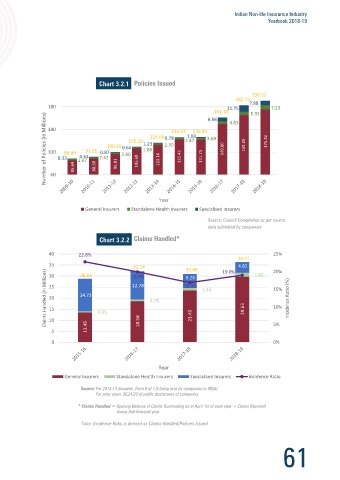
Chart 3.2.1
190.53
182.75
7.88
180 11.75 7.23
161.18 5.92
This chapter gives a snapshot of Non-Life Insurance Industry performance from the period 2009-10 to 2018-19. 140 126.07 126.49 6.56 4.83
1.08
The Non-Life Insurance Insurers have maintained a steady growth, maintained Solvency margins and marginally improved 109.20 116.68 0.78 2.87 3.69 175.42
overall profitability despite many challenges faced by them during the last 10 years. Market competition dominated all lines Number of Policies (in Millions) 100.28 0.64 1.23 2.30 149.80 165.09
91.65
88.49
of business other than mandated Motor Third Party Insurance since April 2007. 100 0.33 0.64 0.87 2.60 1.88 113.16 122.42 121.73
Uninsured vehicles in the Country for Motor TP liability insurance are receiving focus from Government, Judiciary, Police 85.69 2.47 88.58 2.42 96.81 106.68
authorities and Regional Transport Authorities. Auto insurers are lending their support by providing Insurance policy details 60
to the Centralised database, “Vahan”. Apex Court directives on 3 year and 5 year long-term Third Party insurance policy is
being implemented for new vehicles. It has been interesting as to how these initiatives have panned out since their inception
in reducing uninsured vehicles on the road..
. Year
Health Insurance has emerged as a significant portfolio accounting for almost one third of the market share. Health & Accident
General Insurers Standalone Health Insurers Specialised Insurers
Insurance segment has grown to 51,213 Crores at a CAGR of 20.07% over the period of 2009-10 to 2018-19.
Source: Council Compilation as per source
data submitted by companies
Table 3.1.1 Number of Insurers as on 31st March 2019 Chart 3.2.2
.
General Insurers 40 22.8% 25%
36.31
. 25 7 2 11 35 28.83 19.9% 30.88 19.0% 4.82 1.85 20%
32.14
Claims Handled (in Millions) 25 14.73 0.65 12.78 0.78 16.9% 1.13 29.63 15% Incidence Ratio (%)
30
6.26
20
10%
15
Since the opening up of the Non-Life Insurance Industry in 2001, the industry has witnessed a substantial improvement 10 13.45 18.58 23.49 5%
5
in operational efficiency, along with a many-fold increase in Premium underwritten.
0 0%
The following highlights show the trends in key operational dimensions during the period of 2009-10 to 2018-19.
Year
General Insurers Standalone Health Insurers Specialised Insurers Incidence Ratio
Note: Incidence Ratio is derived as Claims Handled/Policies Issued
60 61