
Page 722 - Insurance Statistics 2021
P. 722
Indian Non-life Insurance Industry
Yearbook 2018-19
Chart 3.2.3
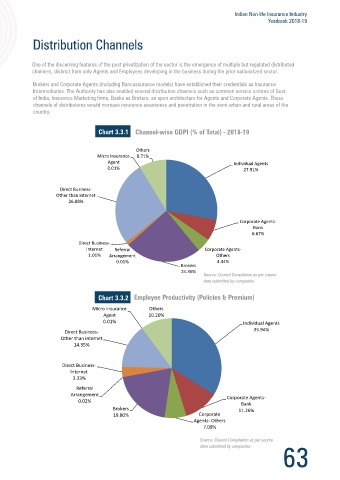
11,575 One of the discerning features of the post privatization of the sector is the emergence of multiple but regulated distributed
12,000 11,061 11,160 channels, distinct from only Agents and Employees developing in the business during the prior nationalized sector.
10,381 10,710 83 86 86
9,850 83 520 593 774 882
10,000 84 458 Brokers and Corporate Agents (including Bancassurance models) have established their credentials as Insurance
83 395
8,031 Intermediaries. The Authority has also enabled several distribution channels such as common service centres of Govt.
of India, Insurance Marketing firms, Banks as Brokers, an open architecture for Agents and Corporate Agents. These
8,000 6,351 6,594 73 7,035 82 361 channels of distributions would increase insurance awareness and penetration in the semi-urban and rural areas of the
Number of Ofices 6,000 75 201 261 293 9,372 9,839 10,107 10,385 10,300 10,607 country.
69
4,000
6,075 6,264 6,669 7,588 Chart 3.3.1 Channel-wise GDPI (% of Total) - 2018-19
2,000
Others
Micro Insurance 8.71%
- Agent Individual Agents
0.01% 27.91%
Year
Direct Business-
General Insurers Standalone Health Insurers Specialised Insurers Other than internet
26.88%
Council Compilation as per source
data submitted by companies
Corporate Agents-
Bank
Chart 3.2.4 6.67%
Direct Business-
1,40,000 1,35,308 Internet Referral Corporate Agents-
1,26,638 920
1.01% Arrangement Others
934
1,16,657 0.01% 4.44%
1,20,000 1,12,536 29,208 Brokers
1,04,968 1,06,776 887 886 25,990 24.36%
99,143 880 872 14,755 19,947 Source: Council Compilation as per source
1,00,000 3,676 92,135 766 93,347 774 95,726 830 11,136 12,625 data submitted by companies
8,915
Number of Employees 80,000 99,714 1,05,180 Micro Insurance 10.20%
778
7,286
6,218
Chart 3.3.2
Others
60,000
Agent
33.94%
40,000 87,681 86,363 87,666 89,398 92,952 93,279 96,894 95,824 Direct Business- 0.01% Individual Agents
Other than internet
14.35%
20,000
-
Direct Business-
Internet
3.33%
Year Referral
Arrangement
General Insurers Standalone Health Insurers Specialised Insurers Corporate Agents-
0.02%
Bank
Source: Council Compilation as per source Brokers 11.26%
data submitted by companies 19.80% Corporate
Agents- Others
7.09%
Source: Council Compilation as per source
data submitted by companies
62 63