
Page 727 - Insurance Statistics 2021
P. 727
Indian Non-life Insurance Industry
Yearbook 2018-19
Chart 3.5.2 (2018-19)
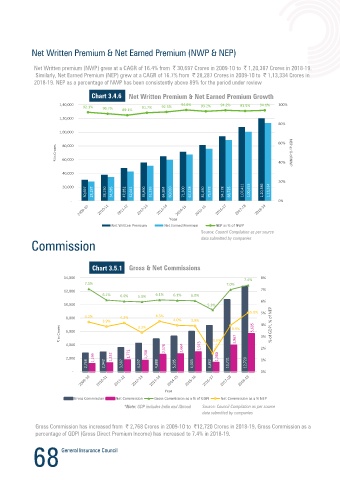
Net Written premium (NWP) grew at a CAGR of 16.4% from 30,697 Crores in 2009-10 to 1,20,387 Crores in 2018-19.
Similarly, Net Earned Premium (NEP) grew at a CAGR of 16.7% from 28,287 Crores in 2009-10 to 1,13,334 Crores in 8000
Commission (₹ in Crores)
2018-19. NEP as a percentage of NWP has been consistently above 89% for the period under review 5765
Chart 3.4.6 Net Written Premium & Net Earned Premium Growth 6000
1,40,000 94.6% 93.2% 94.2% 93.5% 94.1% 100% 3969
92.1% 91.7% 92.5% 4000
90.7% 89.1%
1,20,000 1600
80% 2000
1,00,000 0 56 207 25 330 16 10 23
60%
80,000
₹ in Crores NEP as % of NWP
60,000
40%
40,000
20%
20,000
30,697 28,287 38,150 34,585 47,852 42,641 55,890 51,226 64,864 60,010 71,300 67,428 81,450 75,878 94,178 88,725 1,07,411 1,00,453 1,20,386 1,13,334
- 0%
Distribution Channel
Year
Source: Public Disclosure data (NL6 of companies)
Net Written Premium Net Earned Premium NEP as % of NWP Note: Corporate Agents share in above charts includes
Source: Council Compilation as per source business through Bancassurance channels
data submitted by companies
Chart 3.5.1 Gross & Net Commissions
14,000 8%
7.4%
7.1% 7.0%
7%
12,000
6.1% 6.0% 5.9% 6.1% 6.1% 6.0%
6%
10,000 5.3%
5.0% 5%
8,000 4.2% 4.2% 4.3%
3.9% 3.3% 4.0% 3.9% 4% % of GDPI, % of NEP
₹ in Crores 6,000 3.9% 5,695 3%
3,967
4,000 2,578 2,664 2,973 1.6% 2%
2,000 1,199 1,332 1,772 1,708 1,380 1%
2,768 2,942 3,587 4,237 4,888 5,295 6,003 6,882 10,731 12,720
- 0%
Year
Gross Commission Net Commission Gross Commission as a % of GDPI Net Commission as a % NEP
*Note: GDP includes India and Abroad Source: Council Compilation as per source
data submitted by companies
Gross Commission has increased from 2,768 Crores in 2009-10 to 12,720 Crores in 2018-19, Gross Commission as a
percentage of GDPI (Gross Direct Premium Income) has increased to 7.4% in 2018-19.
68 69