
Page 730 - Insurance Statistics 2021
P. 730
Indian Non-life Insurance Industry
Yearbook 2018-19
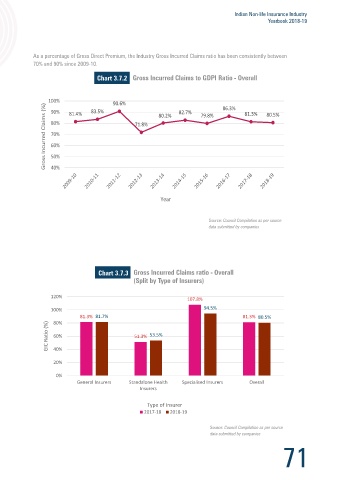
As a percentage of Gross Direct Premium, the Industry Gross Incurred Claims ratio has been consistently between
70% and 90% since 2009-10.
Chart 3.6.1 Chart 3.7.2
35,000 50%
30,604
27,930 26,785 45% 100% 90.6%
28,000 86.3%
23,566 40% 90% 81.4% 83.5% 80.2% 82.7% 79.8% 81.3% 80.5%
20,324
32.3%
₹ in Crores 21,000 27.8% 14,223 16,039 30.1% 31.1% 31.5% 27.0% 30% EoM (%) Gross Incurred Claims (%) 80% 71.8%
35%
30.9%
70%
14,000
8,746 11,163 11,861 27.8% 26.7% 26.7% 25%
20% 60%
7,000
15% 50%
- 10% 40%
Year
Year
EOM EoM as % of NEP
Source: IRDAI Annual Reports for prior years and Financial Highlights of GI Council
Source: Council Compilation as per source
data submitted by companies
Expenses of Management have been steadily rising from 8,746 Crores in 2009-10 to 30,604 Crores in 2018-19,
reflecting a CAGR of 14.93%.
Chart 3.7.3
Gross Incurred Claims has risen from 31,924 Crores in 2009-10 to 1,38,827 Crores in 2018-19 at a CAGR of 17.74%
120%
107.8%
Chart 3.7.1 100% 94.5%
1,38,827
1,40,000 81.3% 81.7% 81.3% 80.5%
1,24,708 7,703
6,070 80%
1,20,000 1,12,371 9,844
4,265
9,746 53.5%
1,00,000 2,889 GIC Ratio (%) 60% 51.3%
79,257
₹ in Crores 60,000 54,201 51,105 1,173 5,126 2,223 40%
72,046
80,000
4,038
64,087
1,505
4,738
40,254
1,311
930
40,000 31,925 2,194 3,284 4,512 20%
2,552 1,289
821 0%
28,551 General Insurers Standalone Health Specialised Insurers Overall
20,000 36,771 49,606 45,662 58,176 65,415 72,995 99,735 1,10,600 1,25,054
- Insurers
Type of Insurer
2017-18 2018-19
Year
General Insurers Standalone Health Insurers Specialised Insurers
Source: Council Compilation as per source
Source: Council Compilation as per source data submitted by companies
data submitted by companies
70 71