
Page 732 - Insurance Statistics 2021
P. 732
Indian Non-life Insurance Industry
Yearbook 2018-19
Net Incurred claims has risen from 24,686 Crores in 2009-10 to 1,01,051 Crores in 2018-19, at a CAGR of 16.95%.
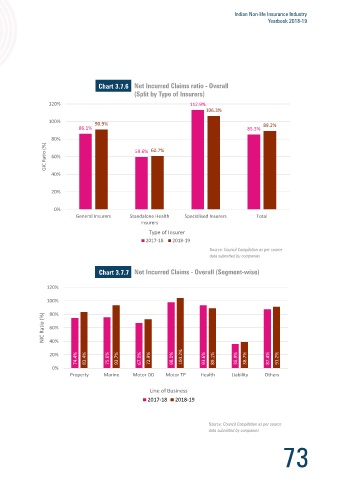
Chart 3.7.4 Chart 3.7.6
1,20,000
120% 112.9%
1,01,051 106.3%
1,00,000
100%
85,650 90.9% 89.2%
80,662 86.1% 85.3%
80,000
80%
₹ in Crores 60,000 49,164 55,232 GIC Ratio (%) 60% 59.6% 60.7%
64,495
37,739 42,550
40,000 32,100 40%
24,686
20,000
20%
-
0%
General Insurers Standalone Health Specialised Insurers Total
Insurers
Year
Type of Insurer
2017-18 2018-19
Source: Council Compilation as per source
Source: Council Compilation as per source
data submitted by companies
data submitted by companies
Chart 3.7.5 Chart 3.7.7
92.8% 120%
95% 90.6% 90.9%
89.2%
90% 87.3% 100%
85% 83.5% 88.5% 81.9% 82.7% 85.0% 85.3% 80%
Claims Ratio (%) 80% 81.4% 83.1% 80.2% 81.9% 79.8% 86.3% 81.3% 80.5% NIC Ratio (%) 60%
75%
40%
70%
65% 71.8% 20% 74.4% 83.4% 75.6% 93.7% 67.0% 72.9% 98.0% 104.2% 93.6% 89.1% 35.9% 38.7% 87.4% 91.2%
60% 0%
Property Marine Motor OD Motor TP Health Liability Others
Line of Business
2017-18 2018-19
Year
GIC Ratio NIC Ratio
Source: Council Compilation as per source
Source: Council Compilation as per source data submitted by companies
data submitted by companies
72 73