
Page 736 - Insurance Statistics 2021
P. 736
Indian Non-life Insurance Industry
Yearbook 2018-19
Chart 3.8.5
130%
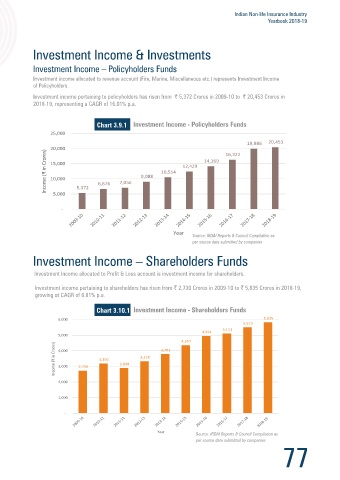
125.6% 122.0% Investment income allocated to revenue account (Fire, Marine, Miscellaneous etc.) represents Investment Income
of Policyholders.
125%
Combined Ratio (%) 120% 119.7% 117.0% 114.2% 117.6% 119.3% Investment income pertaining to policyholders has risen from 5,372 Crores in 2009-10 to 20,453 Crores in
2018-19, representing a CAGR of 16.01% p.a.
115%
110% 111.6% 110.6% 113.9% 25,000 Chart 3.9.1
19,986 20,453
20,000
105% 15,000 14,169 16,322
Income (₹ in Crores) 9,088 10,514 12,429
Year 10,000
6,676 7,056
Source: Council Compilation as per source 5,372
data submitted by companies 5,000
-
Year Source: IRDAI Reports & Council Compilation as
per source data submitted by companies
Chart 3.8.6 Investment Income allocated to Profit & Loss account is investment income for shareholders.
175% Investment income pertaining to shareholders has risen from 2,730 Crores in 2009-10 to 5,835 Crores in 2018-19,
growing at CAGR of 8.81% p.a.
150%
125% 114.7% 120.2% 103.5%107.0% 116.0% 113.9% 119.3% Chart 3.10.1
Combined Ratio (%) 100% 103.7% 6,000 4,357 4,954 5,111 5,513 5,835
75%
5,000
50%
25% Income (₹ in Crores) 4,000 3,190 3,328 3,791
0% 3,000 2,730 2,898
General Insurers Standalone Health Specialised Insurers Overall
Insurers 2,000
1,000
Type of Insurer
2017-18 2018-19
-
Source: Council Compilation as per source
data submitted by companies
Year
Source: IRDAI Reports & Council Compilation as
per source data submitted by companies
76 77