
Page 740 - Insurance Statistics 2021
P. 740
Indian Non-life Insurance Industry
Yearbook 2018-19
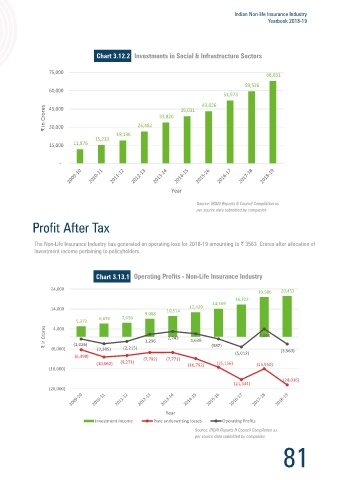
Chart 3.12.2
The Investment portfolio of the General Insurance Industry has increased from 48,891 Crores in 2009-10 to 2,55,245 Crores 75,000 68,031
in 2018-19, at a CAGR of 20.16 % p.a.
59,536
60,000
51,973
Chart 3.12.1 45,000 39,031 43,026
₹ in Crores 33,820
3,00,000
2,55,245 30,000 11,876 15,233 19,136 26,482
2,50,000
Investments (₹ in Crores) 2,00,000 77,103 1,05,888 1,20,854 1,39,887 1,54,783 1,79,371 15,000
2,15,524
1,50,000
-
1,00,000
62,743
48,891
Year
50,000
Source: IRDAI Reports & Council Compilation as
-
per source data submitted by companies
Year
Source: IRDAI Reports & Council Compilation as The Non-Life Insurance Industry has generated an operating loss for 2018-19 amounting to 3563 Crores after allocation of
per source data submitted by companies
Investment income pertaining to policyholders.
Chart 3.13.1
24,000
19,986 20,453
16,322
14,169
14,000 10,514 12,429
9,088
6,676 7,056
5,372
₹ in Crores (1,026) 1,296 2,743 1,638 4,036
4,000
(987)
(2,215)
(6,000)
(3,385)
(5,012) (3,563)
(6,398) (7,792) (7,771)
(10,062) (9,271) (10,792) (15,156) (15,950)
(16,000)
(24,016)
(21,334)
(26,000)
Year
Investment Income Pure underwriting losses Operating Profits
Source: IRDAI Reports & Council Compilation as
per source data submitted by companies
80 81