
Page 742 - Insurance Statistics 2021
P. 742
Indian Non-life Insurance Industry
Yearbook 2018-19
Chart 3.14.2 Shareholders Equity (Split by Type of Company)
The Non-Life Insurance Industry has been continuously generating PAT since 2012-13. In the year 2018-19 the Profit After
Tax was 683 Crores 80,000 68,196
63,959
70,000
Chart 3.13.2 54,521 55,167
60,000 52,422
11,500 50,000 44,662
9,549
9,000 ₹ in Crores 40,000
6,534 6,909 30,000
6,500 5,994 5,513 5835
4,623 4,645 4,848 4,954 5,111 20,000 3,918 4,237 5,244 6,586 7,300 8,431
3,598
₹ in Crores 4,000 1,704 2,730 2,898 3,328 3,791 4,357 3,967 3,240 792 4,036 2,272 10,000
3,190
-
684
(196)
1,500
1,171
Standalone Health
General Insurers
98
683
Insurers Specialised Insurers Total
438 1,296 (987)
(1,000) 2,743 1,638 Type of Insurer
(741)
(1,026) 2016-17 2017-18 2018-19
Source: IRDAI Reports & Council Compilation as
(3,500) (2,215)
(3,385) (3,563) per source data submitted by companies
(5,012)
(6,000)
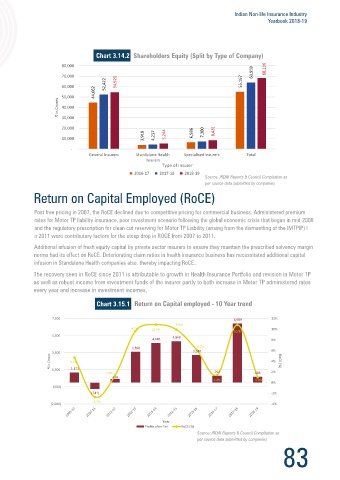
Post free pricing in 2007, the RoCE declined due to competitive pricing for commercial business. Administered premium
Year
Profits after investment income Profits after tax Operating Profits Investment income - Shareholders rates for Motor TP liability insurance, poor investment scenario following the global economic crisis that began in mid-2008
and the regulatory prescription for clean cut reserving for Motor TP Liability (arising from the dismantling of the IMTPIP) I
Source: IRDAI Reports & Council Compilation as
per source data submitted by companies n 2011 were contributory factors for the steep drop in ROCE from 2007 to 2011.
Additional infusion of fresh equity capital by private sector insurers to ensure they maintain the prescribed solvency margin
norms had its effect on RoCE. Deteriorating claim ratios in health insurance business has necessitated additional capital
infusion in Standalone Health companies also, thereby impacting RoCE..
The recovery seen in RoCE since 2011 is attributable to growth in Health Insurance Portfolio and revision in Motor TP
Since 2009-10, Shareholders’ Equity (representing Equity Share Capital plus Free Reserves less accumulated losses) of Non-Life as well as robust income from investment funds of the insurer partly to both increase in Motor TP administered rates
Insurance Industry has increased from 24,791 Crores to 68,196 Crores in 2018-19, representing a CAGR of 11.9% over every year and increase in investment incomes.
the period.
Chart 3.15.1
Chart 3.14.1
7,500 12%
80,000 6,909
68,196 9.9%
70,000 63,959 9.7% 10.9% 10.8% 10%
60,000 52,579 55,167 5,500 4,645 4,848 8%
48,774 3,598 6.2%
₹ in Crores 40,000 24,791 27,503 31,667 37,225 ₹ in Crores 3,500 4.7% 3,240 6% RoCE (%)
50,000
42,806
4%
30,000
20,000 1,500 1,171 1.4% 792 683 2%
438
10,000 1.4% 1.0% 0%
(500)
-
(741) -2%
-2.7%
(2,500) -4%
Year
Year
Source: IRDAI Reports & Council Compilation as Profits after Tax RoCE (%)
per source data submitted by companies Source: IRDAI Reports & Council Compilation as
per source data submitted by companies
82 83