
Page 738 - Insurance Statistics 2021
P. 738
Indian Non-life Insurance Industry
Yearbook 2018-19
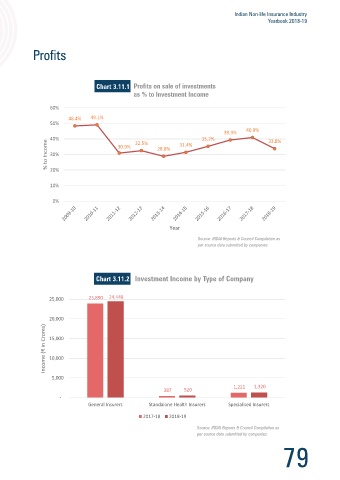
Chart 3.10.2 Chart 3.11.1
20%
60%
17.80% 17.68% 48.4% 49.1%
18%
50%
16% 40% 35.2% 39.3% 40.9%
Yield (%) 14.24% 13.57% 30.9% 32.5% 28.8% 31.4% 33.8%
14%
12.62% 12.88% 12.98% 12.83% 12.91% % to Income 30%
12% 11.17% 20%
10%
10%
0%
Year
Source: IRDAI Reports & Council Compilation as Year
per source data submitted by companies
Source: IRDAI Reports & Council Compilation as
per source data submitted by companies
Profits on sale of investments, has risen from 3,501 Crores in 2009-10 to 8,742 Crores in 2018-19.
Chart 3.10.3 Chart 3.11.2 Investment Income by Type of Company
12,000
25,000 23,890 24,448
9,601
10,000
8,000 7,973 8,742 20,000
Income (₹ in Crores) 6,000 3,501 4,407 3,631 3,854 4,882 6,238 Income (₹ in Crores) 15,000
4,000
2,000 3,064 10,000
5,000
-
1,221 1,320
387 520
-
General Insurers Standalone Health Insurers Specialised Insurers
Year
2017-18 2018-19
Source: IRDAI Reports & Council Compilation as
per source data submitted by companies Source: IRDAI Reports & Council Compilation as
per source data submitted by companies
78 79