
Page 734 - Insurance Statistics 2021
P. 734
Indian Non-life Insurance Industry
Yearbook 2018-19
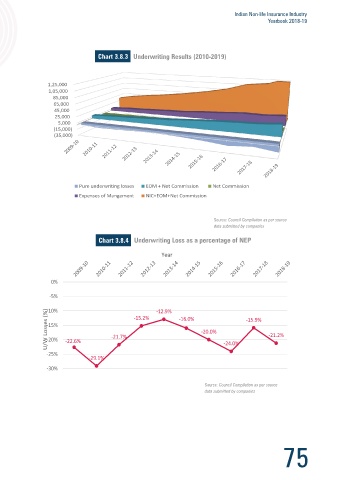
Chart 3.8.3 Underwriting Results (2010-2019)
Underwriting Surplus, which is calculated as Net Earned Premium less sum of Net Incurred Claims, Net Commission,
Expenses of Management and Other Outgo (or income), continues to remain negative.
1,25,000
1,05,000
Chart 3.8.1 Underwriting Results (Split by Type of Insurers)
85,000
65,000
General Insurers Standalone Health Insurers Specialised Insurers 45,000
- 25,000
(491) (922) (212) (398) 5,000
(15,000)
(5,000) (35,000)
Losses (₹ in Crores) (10,000)
(15,000)
(20,000) (15,314)
Pure underwriting losses EOM + Net Commission Net Commission
(25,000) (22,689) Expenses of Mangement NIC+EOM+Net Commission
Type of Insurer
2017-18 2018-19 Source: Council Compilation as per source Source: Council Compilation as per source
data submitted by companies data submitted by companies
Chart 3.8.2 Underwriting Surplus/Deficits (2009-2018) Chart 3.8.4
Year Year
-
0%
(5,000)
(10,000) (6,398) (7,792) -5%
Losses (₹ in Crores) (15,000) (10,062) (9,271) (7,771) (10,792) (15,156) (15,950) -10% -15.2% -12.9% -16.0% -15.9%
U/W Losses (%)
-15%
(20,000)
(25,000) (21,334) -20% -22.6% -21.7% -20.0% -24.0% -21.2%
(24,016)
(30,000) -25%
-29.1%
Source: Council Compilation as per source
-30%
data submitted by companies
Underwriting surplus/deficit of Non-Life Insurance sector continues to be impacted by: Source: Council Compilation as per source
data submitted by companies
Intense competition in the Personal Lines of Business
Frequent natural calamities and disasters
74 75