
Page 726 - Insurance Statistics 2021
P. 726
Indian Non-life Insurance Industry
Yearbook 2018-19
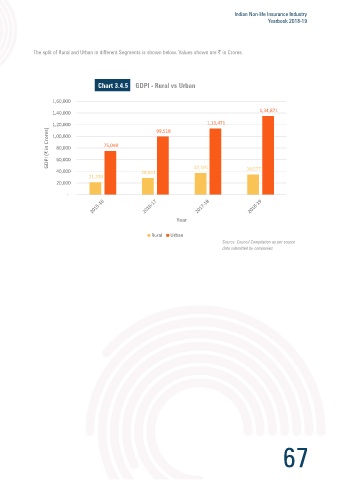
The split of Rural and Urban in different Segments is shown below. Values shown are in Crores.
Gross Written Premium (both domestic and international business) grew by 17.3% on an annual average basis from
43,652 Crores in 2009-10 to 1,75,899 Crores in 2018-19.
Chart 3.4.5 GDPI - Rural vs Urban
ECGC and AIC are categorized as Specialised Companies for the purpose of analysis.
1,60,000
1,34,871
1,40,000
Chart 3.4.3
1,20,000 1,13,471
2,00,000 99,518
1,80,000 1,248 1,00,000
6,907
1,60,000 1,240 11,372 75,049
7,896 GDPI (₹ in Crores) 80,000
1,40,000 1,268 6,988 8,333 60,000
₹ in Crores 1,20,000 1,157 1,304 3,395 1,362 2,740 1,321 3,521 5,856 40,000 21,330 28,611 37,191 34,577
1,00,000
4,239
80,000
3,001
1,726
60,000 885 1,005 2,577 3,297 2,245 1,20,066 1,39,159 1,56,373 20,000
813 1,537 93,315
1,520
40,000 1,082 49,143 1,950 63,008 1,660 68,096 76,083 83,261 -
20,000 40,237
-
Year
Rural Urban
Year
Source: Council Compilation as per source
data submitted by companies
General Insurers Standalone Health Insurers AIC ECGC
Source: Council Compilation as per source
data submitted by companies
Chart 3.4.4
1.9% 1.7% 1.5% 1.6% 1.6% 1.5% 1.3% 0.9% 0.8% 0.7%
100%
3.5% 3.6% 3.8% 4.4% 4.1% 3.0% 3.4% 5.2% 5.0% 3.9%
2.5% 2.9% 2.4% 2.3% 2.7% 3.3% 4.1% 4.4% 5.3% 6.5%
80%
% to Total GWP 60% 92.2% 91.8% 92.3% 91.7% 91.6% 92.1% 91.1% 89.5% 88.8% 88.9%
40%
20%
0%
Year
General Insurers Standalone Health Insurers AIC ECGC
Source: Council Compilation as per source
data submitted by companies
66 67