
Page 724 - Insurance Statistics 2021
P. 724
Indian Non-life Insurance Industry
Yearbook 2018-19
Chart 3.3.3 Growth in GDPI split by Distribution Channel
50000.00
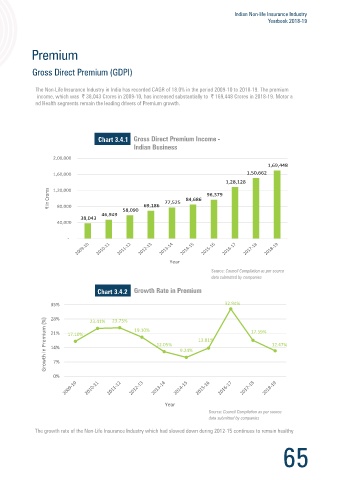
The Non-Life Insurance Industry in India has recorded CAGR of 18.0% in the period 2009-10 to 2018-19. The premium
income, which was 38,043 Crores in 2009-10, has increased substantially to 169,448 Crores in 2018-19. Motor a
nd Health segments remain the leading drivers of Premium growth.
40000.00
GDPI (₹ in Crores) 30000.00 44,538 41,469 47,299 41,278 45,545 14,764 Chart 3.4.1
20000.00
9,018 8,444 33,440 12,259 11,294 2,00,000 1,69,448
10000.00 7,526 1,60,000 1,50,662
1,433 1,707 1,28,128
5 57 15 20 1,20,000 96,379
0.00 ₹ in Crores 77,525 84,686
Year 80,000 58,090 69,186
46,949
38,043
40,000
Individual Agents Corporate Agents-Bank Corporate Agents- Others
Brokers Referral Arrangement Direct Business- Internet
-
Direct Business- Other than internet Micro Insurance Agent Others
Source: Council Compilation as per source
Year
data submitted by companies
Source: Council Compilation as per source
data submitted by companies
For the year 2018-19, share of premium sourced through direct channels has decreased slightly to 36.6 %. The share of
premium via Individual Agents has decreased marginally to 27.9%. Offsetting these reductions, Corporate Agency share Chart 3.4.2
has increased to about 11.0% and share of premium via Brokers has increased marginally to 24.4%.
35% 23.41% 23.73% 32.94%
Growth in Premium (%) 21% 17.10% 19.10% 12.05% 9.24% 13.81% 17.59% 12.47%
28%
14%
7%
0%
Year
Source: Council Compilation as per source
data submitted by companies
The growth rate of the Non-Life Insurance Industry which had slowed down during 2012-15 continues to remain healthy
64 65