
Page 779 - Insurance Statistics 2021
P. 779
Indian Non-life Insurance Industry
Yearbook 2018-19
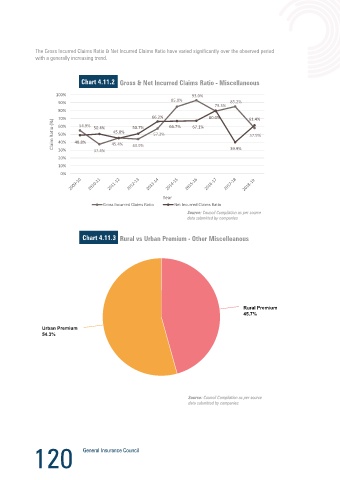
The Gross Incurred Claims Ratio & Net Incurred Claims Ratio have varied significantly over the observed period
with a generally increasing trend. Chart 4.11.4 Channelwise GDPI - Other Miscelleanous
Chart 4.11.2
Chart 4.5.2 Gross & Net Incurred Claims Ratio - Miscellaneous
Others
Others
1.3%
1.3%
100% 93.0%
85.0%
90% 85.2%
Micro Insurance Agent
79.3% Micro Insurance Agent Individual Agents
Individual Agents
0.0%
80% 0.0% 23.5%
23.5%
70% 54.9% 66.2% 80.0% 61.4% Direct Business- Oth…
Claim Ratio (%) 50% 48.8% 50.4% 45.4% 50.7% 57.3% 66.7% 67.1% 57.9% 21.4%
Direct Business- Oth…
60%
21.4%
45.0%
40%
Direct Business- I…
Direct Business- I…
43.9%
30%
0.5%
20% 37.4% 39.9% 0.5%
Arrange…
Referral Arrange…
Referral
10%
0.1%
0.1%
0%
Corporate Agents-B…
Year Corporate Agents-B…
17.6%
Gross Incurred Claims Ratio Net Incurred Claims Ratio 17.6%
Source: Council Compilation as per source
data submitted by companies
Brokers
Brokers
Corporate Agents- Others
33.5% Corporate Agents- Others
33.5%
2.1%
Chart 4.11.3 2.1%
Chart 4.5.2 Rural vs Urban Premium - Other Miscelleanous
Source: Council Compilation as per source
data submitted by companies
A perceptible pattern has been observed between Gross Incurred Claims Ratio and Net Incurred Claims Ratio in respect of
Property (Fire and Engineering), Marine and Aviation and Other Miscellaneous classes of business. The Net Incurred Claims
in these classes are lower than the Gross Incurred Claims showing the efficacy of the Reinsurance Programme of the insurers
for these segments. In respect of Motor and Health segments, the Net Incurred Claims have been higher than the Gross
Incurred Claims reflecting the maximum domestic and net retentions in these segments.
Rural Premium
Rural Premium
45.7%
45.7%
Urban Premium
Urban Premium
54.3%
54.3%
Source: Council Compilation as per source
data submitted by companies
120 121