
Page 774 - Insurance Statistics 2021
P. 774
Indian Non-life Insurance Industry
Yearbook 2018-19
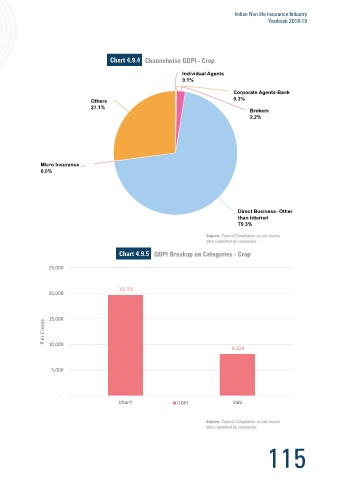
Chart 4.9.2 Chart 4.9.4 Channelwise GDPI - Crop
Chart 4.5.2 Gross & Net Incurred Claims Ratio - Crop
Individual
Individual Agents
Agents
140%
0.1%
0.1%
116.3% 116.9% 120.0%
120% 106.2%
101.4% 105.4% 101.7%
Agents-Bank
Corporate
99.7% 119.8% Corporate Agents-Bank
0.3%
100% 108.5% 0.3%
104.6% 102.2% Others
Others
97.9%
80.2%
Claim Ratio (%) 80% 71.3% 92.2% 73.1% 77.3% 75.8% 90.5% Brokers
27.1%
27.1%
74.5%
Brokers
2.2%
2.2%
68.7%
60%
40%
20%
0%
Micro Insurance …
Micro Insurance …
0.0%
0.0%
Year
Gross Incurred Claims Ratio Net Incurred Claims Ratio
Source: Council Compilation as per source
data submitted by companies
Direct Business- Other
Direct Business- Other
than internet
than internet
70.3%
70.3%
Chart 4.9.3 Source: Council Compilation as per source
Chart 4.5.2 Rural vs Urban Premium - Crop
data submitted by companies
Chart 4.9.5 GDPI Breakup on Categories - Crop
Urban Premium
Urban Premium
25,000
23.4%
23.4%
19,705
20,000
15,000
₹ in Crores
10,000
8,124
5,000
Rural Premium
Rural Premium
76.6%
76.6%
-
Kharif GDPI Rabi
Source: Council Compilation as per source Source: Council Compilation as per source
data submitted by companies data submitted by companies
114 115