Page 771 - Insurance Statistics 2021
P. 771

Indian Non-life Insurance Industry
                                                                                                                                                                                                                      Yearbook 2018-19


                                                                                                                                         Crop
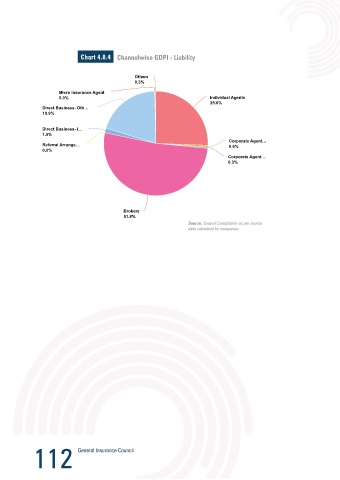
                             Chart 4.8.4 Channelwise GDPI - Liability

                                                                                                                                         Crop insurance has seen significant growth in 2017-18 & 2018-19 due to PM’s flagship programme for farmers –
                                                Others
                                                Others                                                                                   Pradhan Mantri Fasal Bima Yojana – (PMFBY).
                                                0.3%
                                                0.3%
                                                                                                                                         Crop as a segment has emerged separately this year. From 2018-19, Crop has been reported across almost all
                      Micro Insurance Agent
                      Micro Insurance
                                 Agent
                      0.0%
                                                                           Individual
                      0.0%                                                 Individual Agents                                             insurance companies. Figures till 2017-18 show figures for Agricultural Insurance Company.
                                                                                  Agents
                                                                           25.6%
                                                                           25.6%
                Direct Business- Oth…
                Direct Business- Oth…
                19.9%
                19.9%                                                                                                                                      Table 4.9.1   Crop
                Direct Business- I…
                Direct Business- I…
                1.5%                                                                                                                                        2018-19                        Value
                1.5%
                                                                                 Corporate  Agent…
                                                                                 Corporate Agent…
                Referral
                      Arrange…
                Referral Arrange…                                                0.6%                                                                       No. Of Policies                1,13,52,931
                                                                                 0.6%
                0.0%
                0.0%
                                                                                 Corporate  Agent…                                                          Premium (in Cr)                 27,614
                                                                                 Corporate Agent…
                                                                                 0.3%
                                                                                 0.3%
                                                                                                                                                            No. Of Claims Reported          99,75,620
                                                                                                                                                            No. Of Paid Claims              1,30,25,092
                                                                                                                                                            Amt of Paid Claims (in Cr)        24,930
                                                                                                                                                                                            16,730
                                                                                                                                                            Amt of Paid Claims (in Cr)  Premium booked in India considered
                                            Brokers
                                            Brokers
                                            51.8%
                                            51.8%
                                                                   Source: Council Compilation as per source
                                                                   data submitted by companies                                                             Chart 4.9.1 GDPI - Crop
                                                                                                                                          30,000
                                                                                                                                                                                                                         27,624
                                                                                                                                          25,000
                                                                                                                                          20,000
                                                                                                                                       ₹ in Crores   15,000


                                                                                                                                          10,000                                                                   7,893
                                                                                                                                                                                                            6,980

                                                                                                                                           5,000                        2,577   3,297  3,395   2,740   3,521
                                                                                                                                                          1,520   1,950
                                                                                                                                                   833
                                                                                                                                              -


                                                                                                                                                                                      Year

                                                                                                                                                                                                 Source: Council Compilation as per source
                                                                                                                                                                                                 data submitted by companies


             112                                                                                                                                                                                                      113
   766   767   768   769   770   771   772   773   774   775   776