
Page 770 - Insurance Statistics 2021
P. 770
Indian Non-life Insurance Industry
Yearbook 2018-19
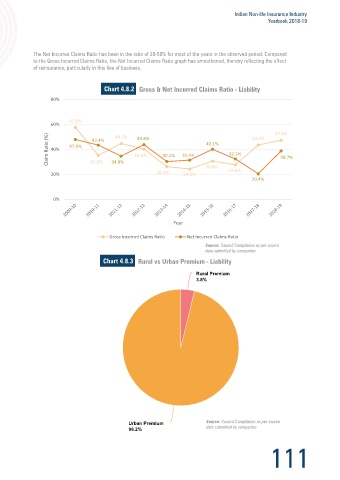
Liability The Net Incurred Claims Ratio has been in the ratio of 20-50% for most of the years in the observed period. Compared
to the Gross Incurred Claims Ratio, the Net Incurred Claims Ratio graph has smoothened, thereby reflecting the effect
of reinsurance, particularly in this line of business.
Liability Insurance comprises of Workmen’s compensation and Employers’ Liability, Public Liability, Products Liability
and other Liability segments (excluding Motor Third Party Liability), Liability Insurance Premium has grown by 13.4%
over the period 2009-10 to 2018-19.
Chart 4.8.2 Gross & Net Incurred Claims Ratio - Liability
80%
Table 4.8.1 Liability
57.6%
2018-19 Value 60%
Claim Ratio (%) 40%
No. Of Policies 7,21,190 43.4% 44.7% 43.8% 43.5% 47.3%
Premium (in Cr) 2,382 47.9% 40.1%
No. Of Claims Reported 35,110 35.2% 34.6% 40.2% 30.2% 31.4% 32.3% 38.7%
No. Of Paid Claims 21,583 30.6% 27.6%
20% 26.2% 24.3%
Amt of Paid Claims (in Cr) 438 20.4%
Premium booked in India considered
0%
Chart 4.8.1
Chart 4.5.2 GDPI - Liability
Year
2,318 Gross Incurred Claims Ratio Net Incurred Claims Ratio
2500
2,039 Source: Council Compilation as per source
1,890 1,912 data submitted by companies
2000
Chart 4.8.3 Rural vs Urban Premium - Liability
Rural Premium
Rural Premium
1,329
1,328
1500
in Crores 1,066 1,163
3.8%
3.8%
1000 887
752
500
0
2009-10 2010-11 2011-12 2012-13 2013-14 2014-15 2015-16 2016-17 2017-18 2018-19
Year
Source: Council Compilation as per source
data submitted by companies
Note: Detailed breakup of Liability Covers is not available.
Urban Premium
Urban Premium Source: Council Compilation as per source
96.2% data submitted by companies
96.2%
110 111