
Page 766 - Insurance Statistics 2021
P. 766
Indian Non-life Insurance Industry
Yearbook 2018-19
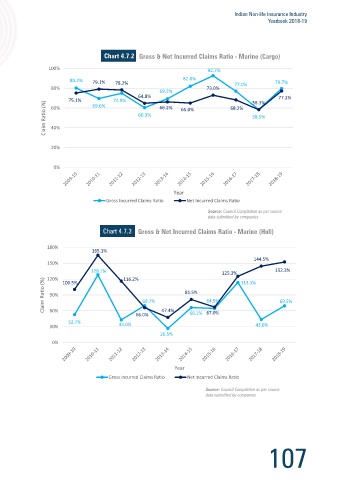
Marine & Aviation Chart 4.7.2 Gross & Net Incurred Claims Ratio - Marine (Cargo)
100%
The composition of Marine and Aviation Insurance business is as mentioned below. 92.7%
80.2% 79.1% 78.2% 82.0% 79.7%
80% 73.0% 77.0%
69.3%
Table 4.7.1 Marine & Aviation 75.1% 69.6% 74.9% 64.8% 58.3% 77.2%
Claim Ratio (%) 60% 60.3% 66.2% 65.0% 68.2% 58.5%
2018-19 Value
No. Of Policies 17,08,211 40%
Premium (in Cr) 3,794
20%
No. Of Claims Reported 3,10,895
No. Of Paid Claims 2,67,291
0%
Amt of Paid Claims (in Cr) 2,982
Premium booked in India considered
Year
Chart 4.7.1 Gross Incurred Claims Ratio Net Incurred Claims Ratio
Chart 4.5.2 Marine & Aviation Insurance
Source: Council Compilation as per source
3,000 2,498 data submitted by companies
2,300
2,500 2,117 2,143 2,194 2,190 Chart 4.7.3 Gross & Net Incurred Claims Ratio - Marine (Hull)
1,927 2,023
2,000 1,598 180% 165.1%
₹ in Crores 1,500 1,316 997 1,126 1,136 1,185 1,011 150% 144.5%
1,000 919 875 827 663 822 120% 128.1% 116.2% 125.3% 152.3%
394 454 494 494 457 429 447 430 411 560 100.5% 113.5%
500 Claim Ratio (%) 90% 81.5%
- 69.7% 64.5% 69.5%
60%
66.0% 47.4% 66.1% 67.0%
52.7% 43.0% 43.6%
30%
Year 26.5%
Marine Cargo Marine Hull Aviation 0%
Source: Council Compilation as per source
data submitted by companies
Year
Aviation Premium has posted an income of greater than 500 Crores in 2018-19, hovering close to this prestigious Gross Incurred Claims Ratio Net Incurred Claims Ratio
benchmark for the past decade. Both the Gross Incurred Claims Ratio and Net Incurred Claims Ratio increased over
the previous year. Source: Council Compilation as per source
data submitted by companies
106 107