Page 764 - Insurance Statistics 2021
P. 764

Indian Non-life Insurance Industry
                                                                                               Yearbook 2018-19


 The Net Incurred Claims ratio for property insurance has been consistently within the range of 46% and 90%
  during the observed period.


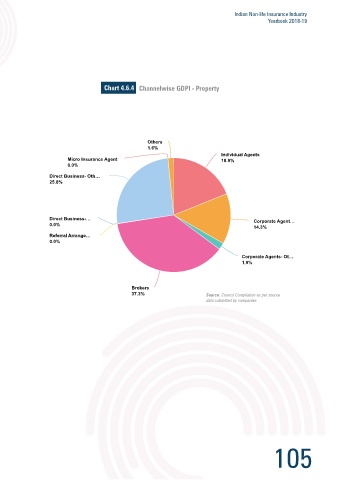
 Chart 4.6.2                          Chart 4.6.4 Channelwise GDPI - Property
 Chart 4.5.2 Gross & Net Incurred Claims Ratio - Property
 100%
 89.3%
 90%  83.4%
 83.7%  84.7%
 79.8%  73.8%  73.0%  80.1%  74.4%
 Loss ratio (%)  70%  65.1%  69.8%  62.0%  75.8%  69.3%  69.5%  79.1%  64.9%  73.7%  Micro Insurance Agent  Others  Individual Agents
 80%
 74.3%
                                                     Others
                                                     1.6%
                                                     1.6%
                                                                                      Agents
                                                                               Individual
                                      Agent
                         Micro Insurance
 60%
                                                                               18.9%
                                                                               18.9%
                         0.0%
                         0.0%
 50%              Direct Business- Oth…
                  Direct Business- Oth…
                  25.8%
                  25.8%
 45.6%
 40%
                  Direct Business-…
 Year             Direct Business-…                                                       Corporate  Agent…
                                                                                          Corporate Agent…
                  0.0%
                  0.0%                                                                    14.3%
                                                                                          14.3%
 Gross Incurred Claims Ratio  Net Incurred Claims Ratio
                         Arrange…
                  Referral Arrange…
                  Referral
                  0.0%
                  0.0%
 Source: Council Compilation as per source
 data submitted by companies
                                                                                      Corporate Agents- Ot…
                                                                                      Corporate  Agents- Ot…
                                                                                      1.9%
                                                                                      1.9%
 Chart 4.6.3
 Chart 4.5.2 Rural vs Urban Premium - Property
 Rural Premium
 Rural Premium
                                               Brokers
 9.3%
 9.3%                                          Brokers
                                               37.3%                     Source: Council Compilation as per source
                                               37.3%
                                                                         data submitted by companies


 Urban Premium  Source: Council Compilation as per source
 Urban Premium
 90.7%  data submitted by companies
 90.7%


 104                                                                                             105
   759   760   761   762   763   764   765   766   767   768   769