
Page 760 - Insurance Statistics 2021
P. 760
Indian Non-life Insurance Industry
Yearbook 2018-19
The Net Incurred Claims ratio has been brought down, arriving at 89.10% in 2018-19.
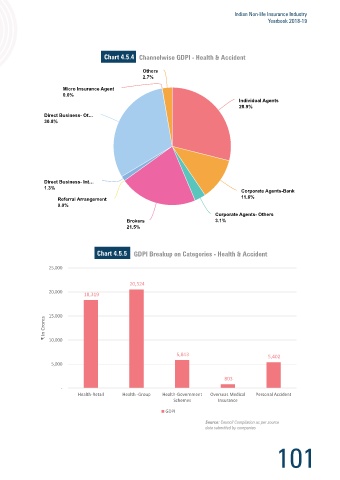
Chart 4.5.4 Channelwise GDPI - Health & Accident
Net Incurred Claims Ratio has dropped higher than Gross Incurred Claims ratio for the segment implying higher earned
premium for the Health industry over the previous years. Others
Others
2.7%
2.7%
Gross & Net Incurred Claims
Chart 4.5.2 Gross & Net Incurred Claims Micro Insurance Agent
Agent
Micro Insurance
Chart 4.5.2
0.0%
Ratio - Health, Personal Accident & Travel
Ratio - Health, P ersonal Accident & T ravel 0.0%
Individual Agents
Individual Agents
28.9%
28.9%
110% 106.1%
Direct Business- Ot…
Direct Business- Ot…
30.8%
100.3% 30.8%
98.4%
100% 95.6% 97.0%
93.9%
92.0%
89.6% 90.3%
94.9%
Loss ratio (%) 85.9% 86.0% 86.7% 91.9% 89.1%
90%
80%
80.7% 81.8% 84.4% 81.6%
78.2%
Direct Business- Int…
Direct Business- Int…
70% 1.3%
1.3%
Corporate Agents-Bank
Corporate Agents-Bank
1 11.6%
1.6%
Referral Arrangement
Referral Arrangement
60% 0.0%
0.0%
2009-10 2010-11 2011-12 2012-13 2013-14 2014-15 2015-16 2016-17 2017-18 2018-19
Corporate Agents- Others
Corporate Agents- Others
Year
3.1%
Brokers
Brokers 3.1%
Gross Incurred Claims Ratio Net Incurred Claims Ratio 21.5%
21.5%
Source: Council Compilation as per source
data submitted by companies
Chart 4.5.5 GDPI Breakup on Categories - Health & Accident
Chart 4.5.3 25,000
Chart 4.5.2 Rural vs Urban Premium - Health & Accident
Rural Premium
Rural Premium
20,524
5.8%
5.8%
20,000
18,319
15,000
₹ In Crores 10,000
5,843 5,402
5,000
803
-
Health-Retail Health -Group Health-Government Overseas Medical Personal Accident
Schemes Insurance
GDPI
Urban Premium
Urban Premium Source: Council Compilation as per source Source: Council Compilation as per source
94.2%
94.2% data submitted by companies data submitted by companies
100 101